Ratings - Average Distance Beaten (ADB)
Each runners past results have a Total Distance Beaten (TBD), for us this is a measured in meters and is how far back a horse was when the winner crossed the line.
Hedger Pro shows Stats for horses (as well as jockeys and trainers) which includes Average Distance Beaten (ADB). This simply takes the average of the TDB of the horses past runs for the period of time covered by the stats - the default for horses is 12 months.
Seems simple enough but there is much to consider.
To consider how good a ADB really is we need to know some stats about ADB for all horses in all races. Is a horse in the bottom 10% or top 10% of runners in performance for example?
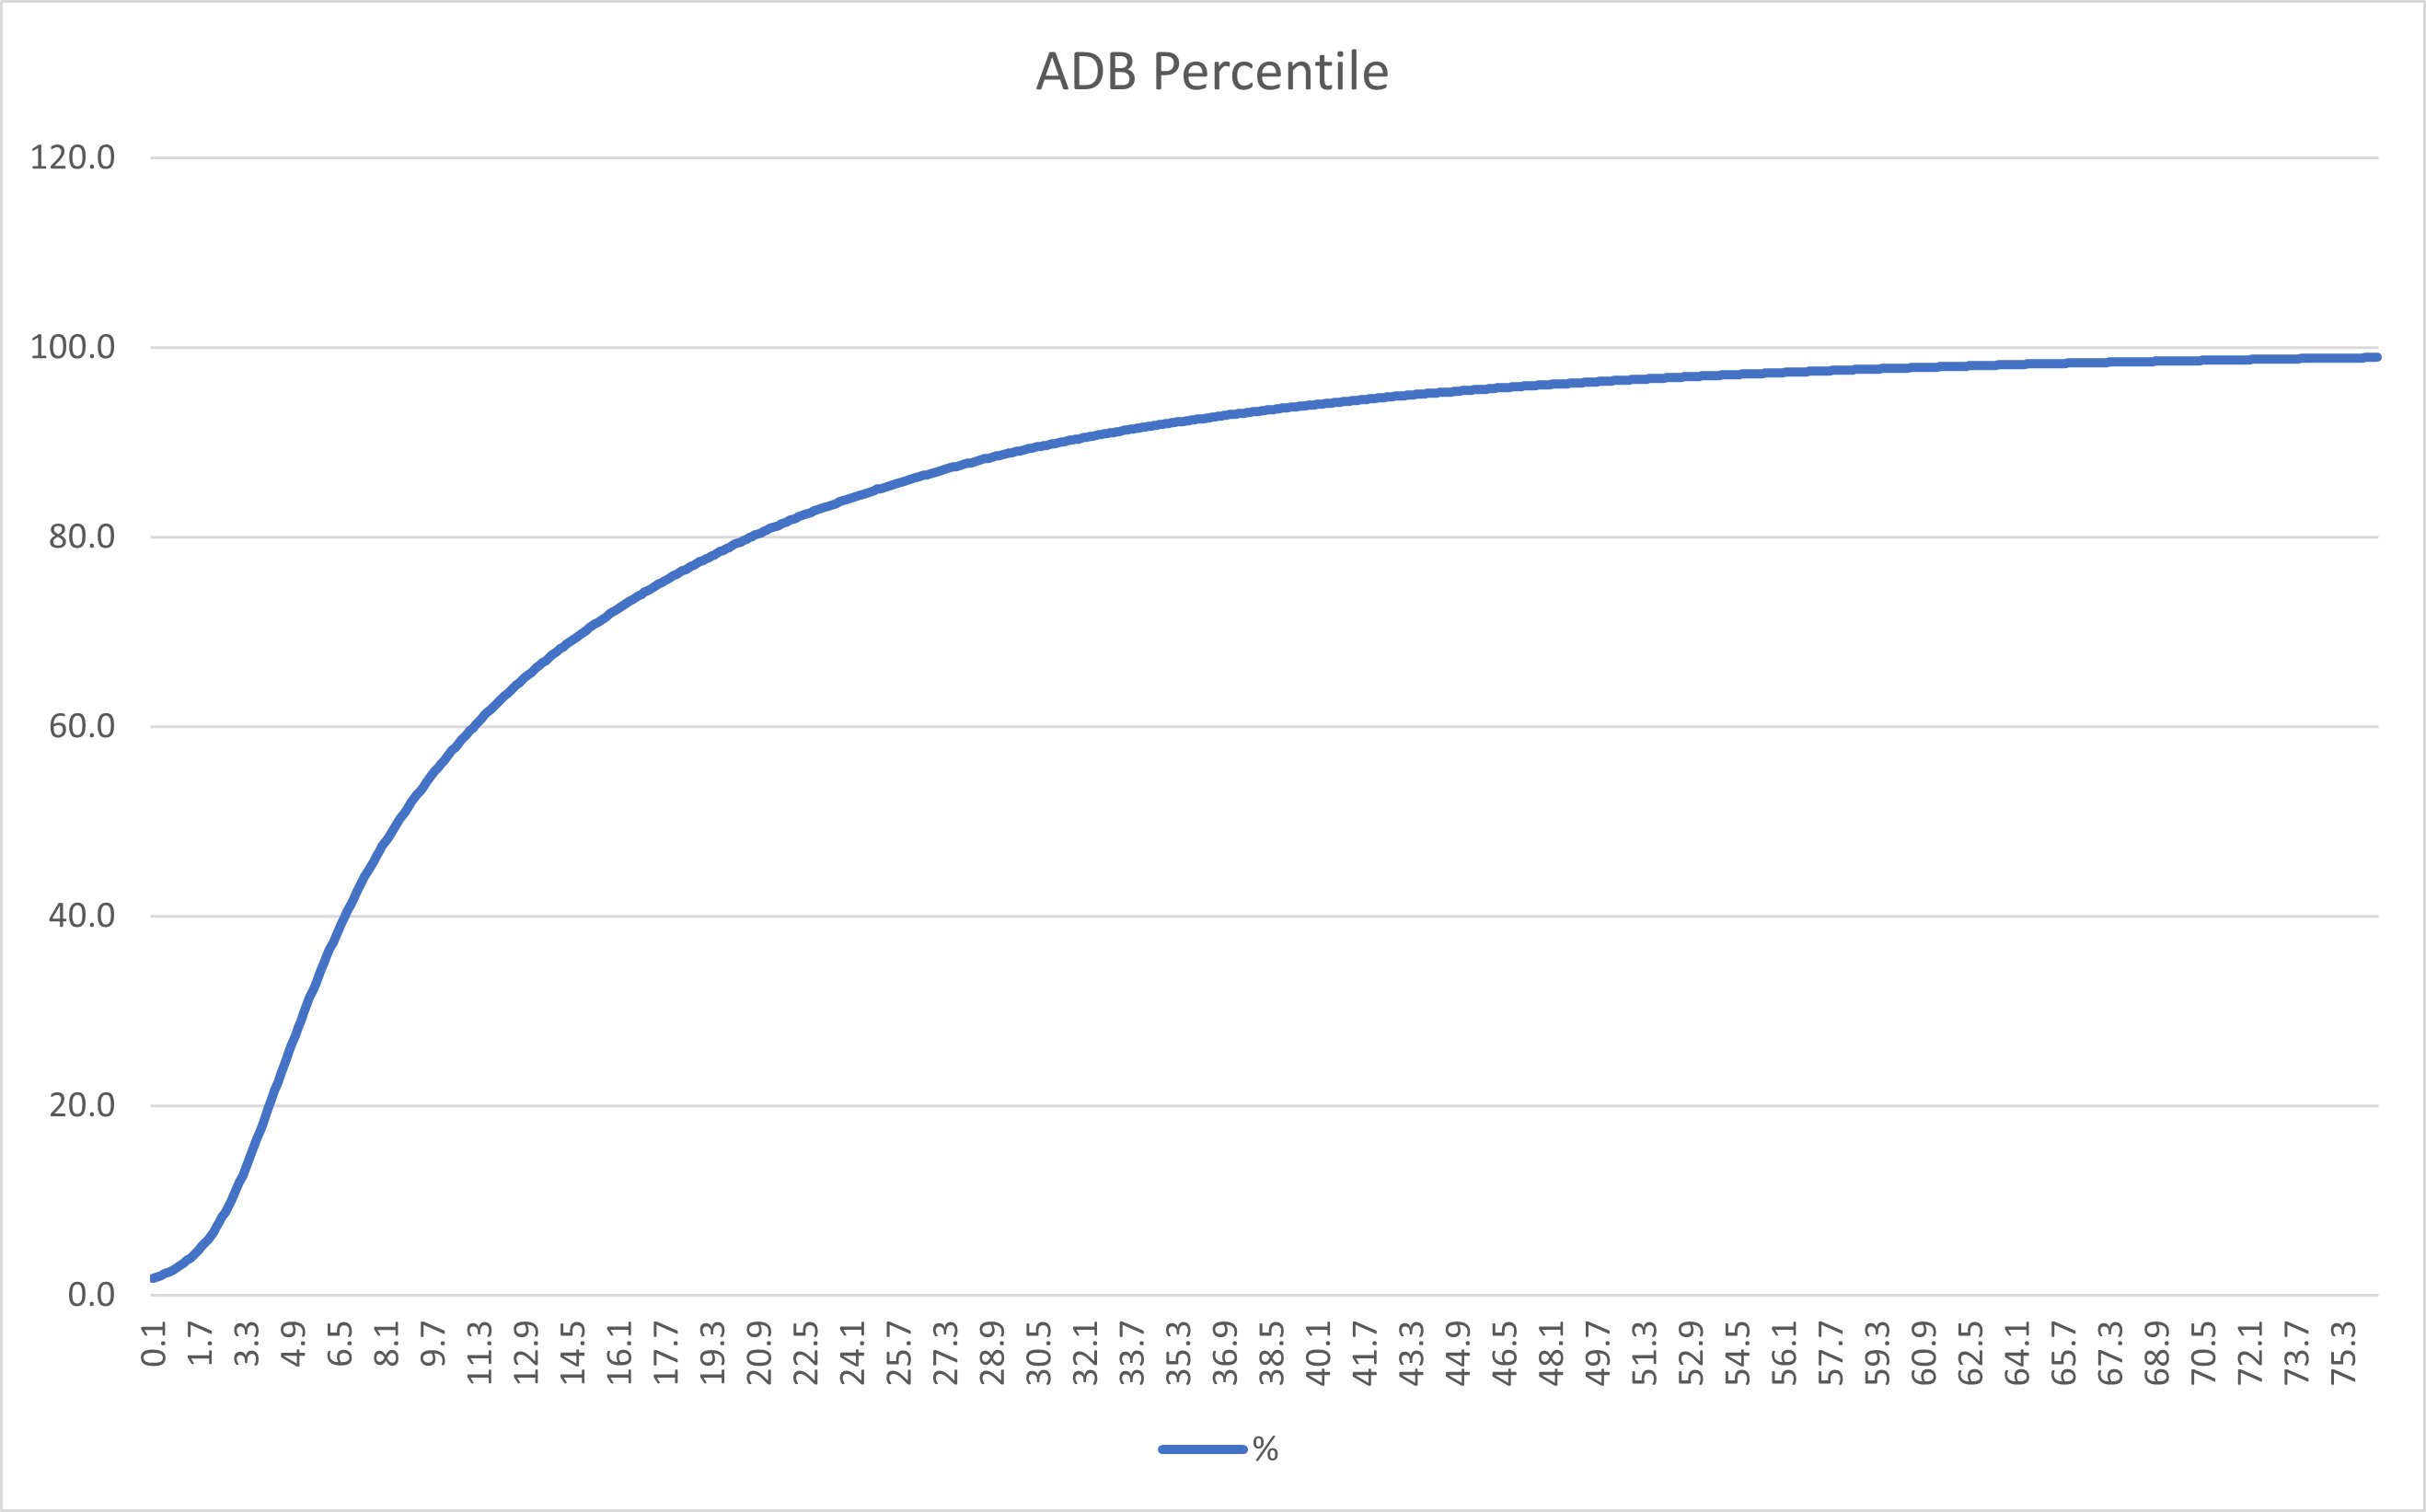
For example an ADB of 1.8m puts a runner inside the top 5% of all runners, 42m in the bottom 5% (from data extracted where past runs was 1 or more).
This leaves us with quite an unsatisfactory looking curve. There's no accounting for a winning horse doing well against the 2nd placed horse, or the pack. A horse could win by 20m and then lose by 20m in its next race. In this case its ADB would be (0 + 20) / 2 = 10. Should it be (-20 + 20) / 2 = 0 with the -20 being how much it won by.
TDB could by measured against the average of the pack (of the race it ran in of course). For all races the average TBD is 7.4, as crudely evidenced here:

Lets say our example runners 2 past races had an average of 7.4m in distance beaten by the pack Now we have: ((0-7.4) + (20-7.4)) / 2 = 2.6
And where would this put our horse compared historically to all other horses:
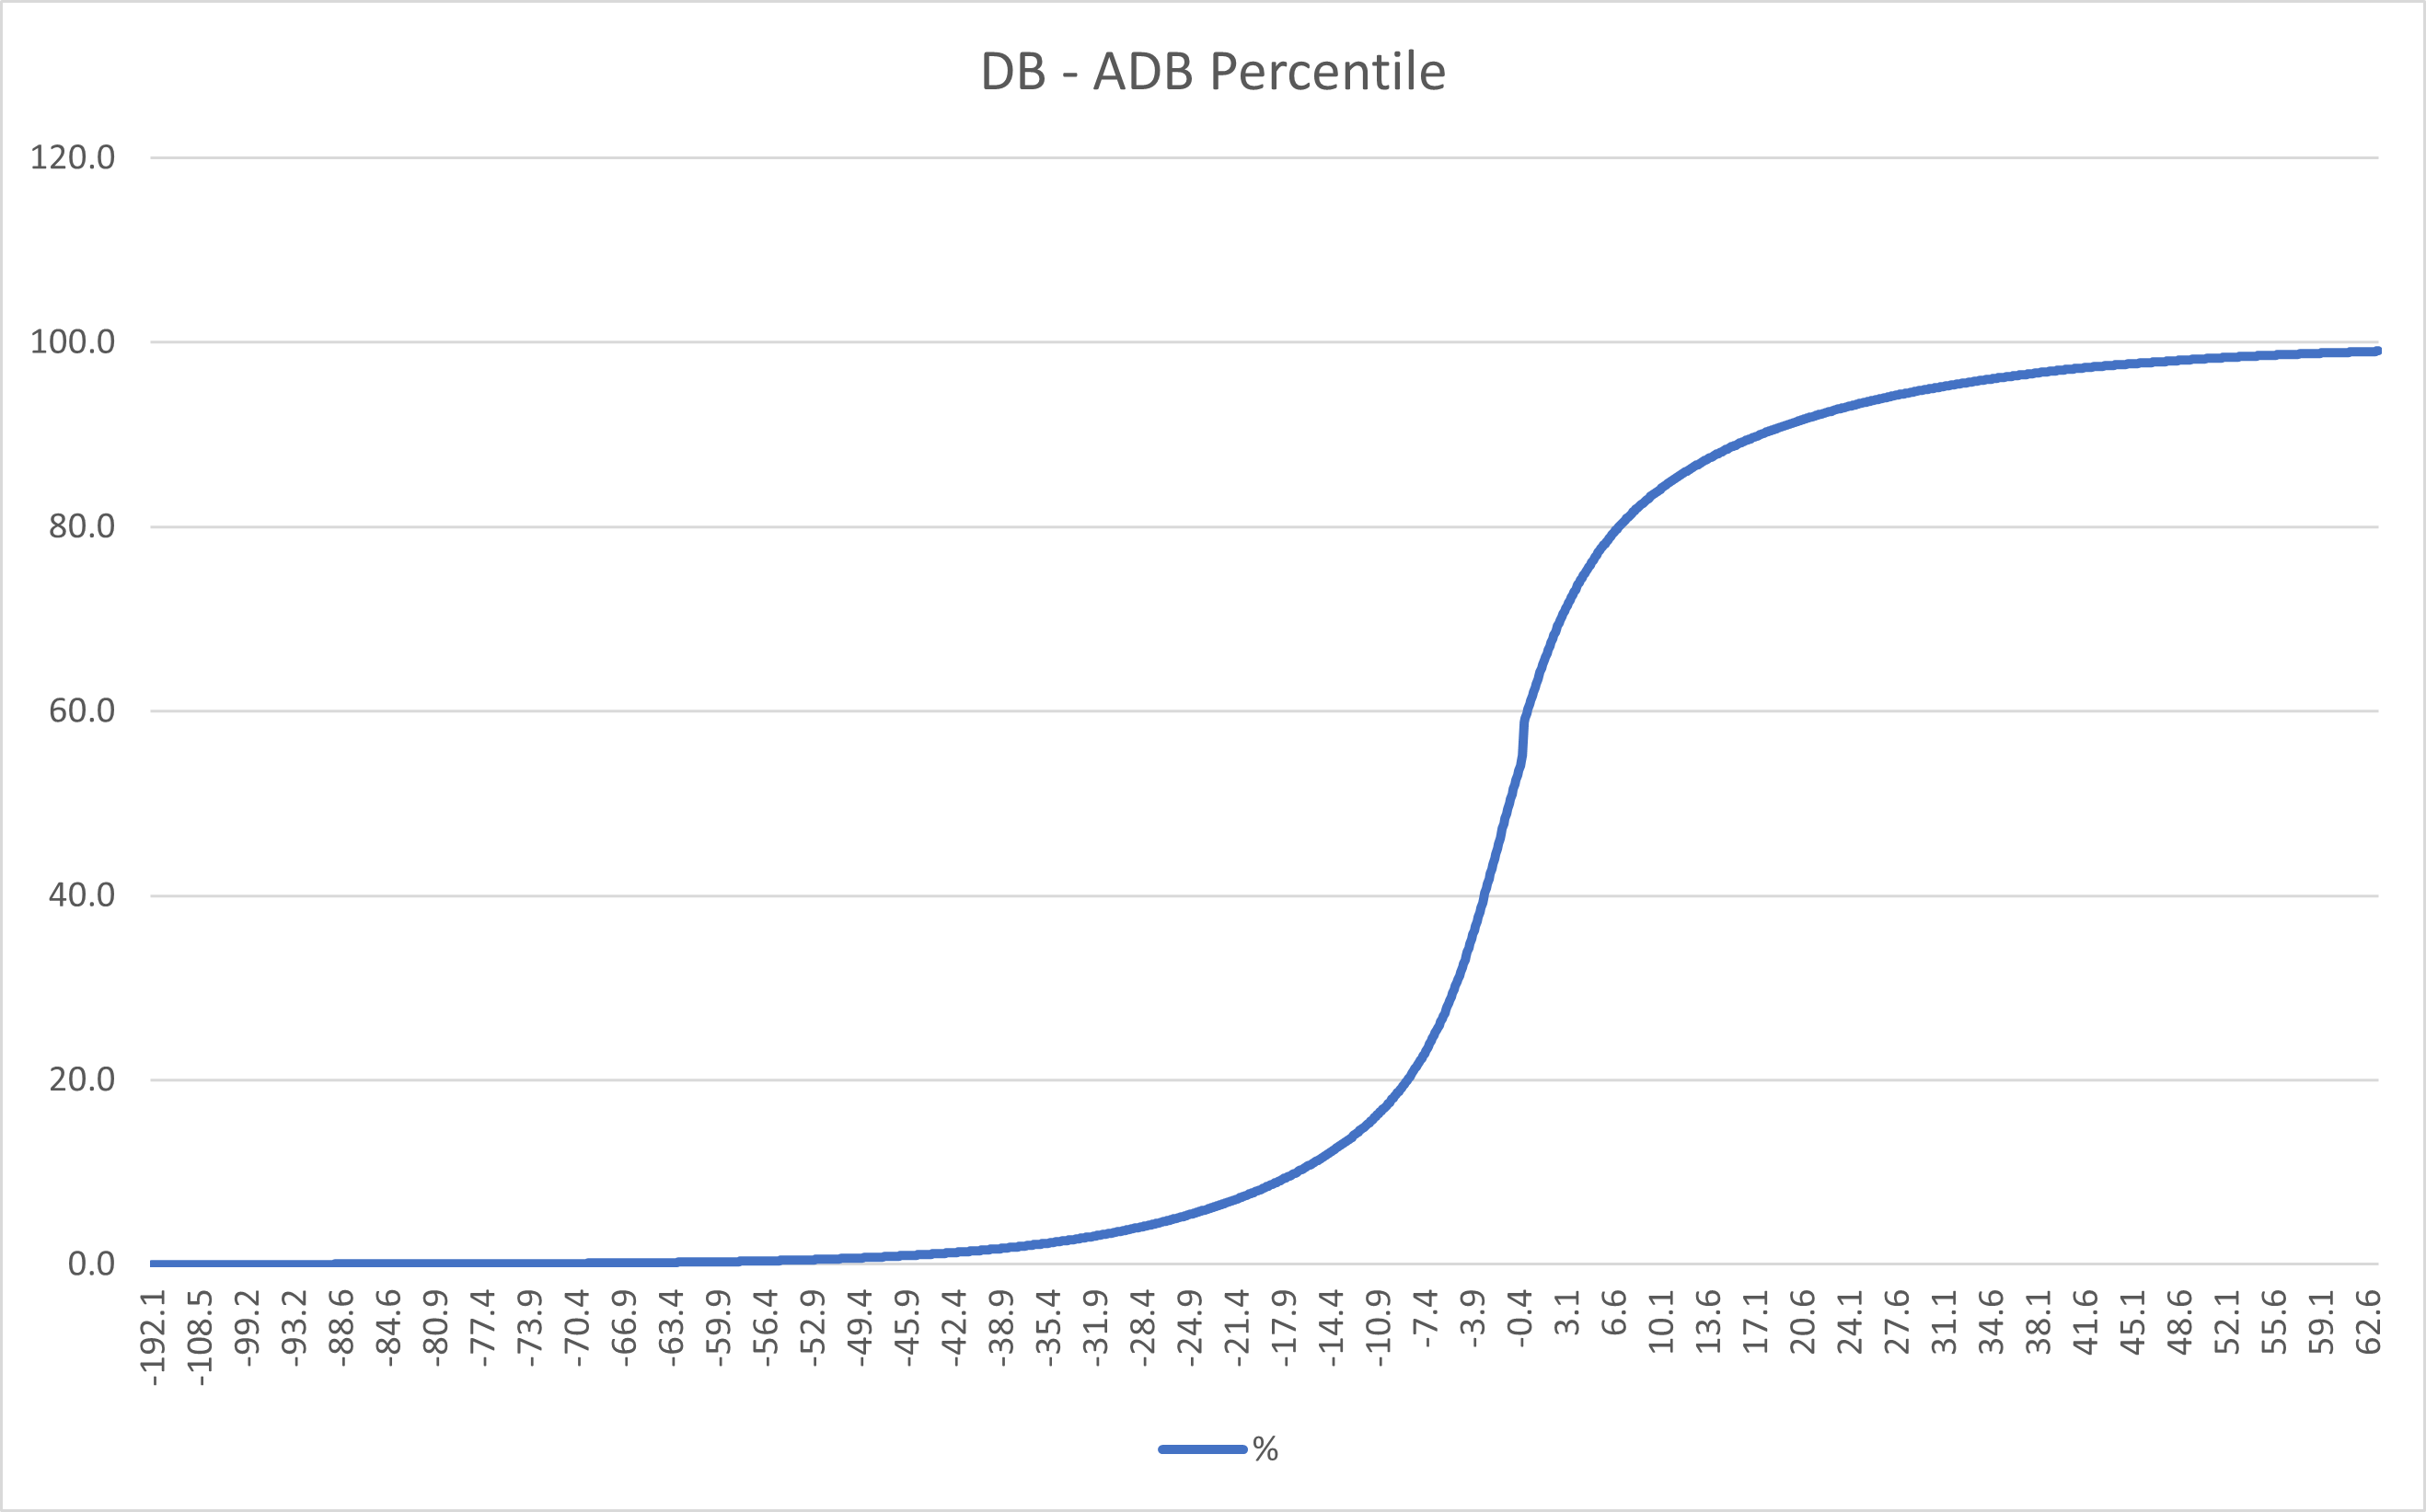
The kink is due to value rounding!
Around 69% as it happens, so - no so good. But lets hang on a minute - there are, to my mind, 2 main things to consider when assessing distance beaten. The speed / length of the races and well beaten horses slowing up against their full capability.
The longer the distance, the more gap there will be between runners. Distance is not the only controller here, there's also going and race type. All race characteristics can be considered , but if we use distance (rounded to 1f), rate type and going as the main contributors and group races together in these categories, we can take a look at average distance beaten against race speeds (in meters per second)
There is quite a spread here in slower races, so some room for improvement to hone down what determines the speed of a race, but here is still a strong trend for the average distance beaten to be lower where the speed of the race is higher - short, hard flat, aw for example. There's quite a considerable TDB at 30 or more meters in long races and 5 or so meters in shorter (fast) ones.
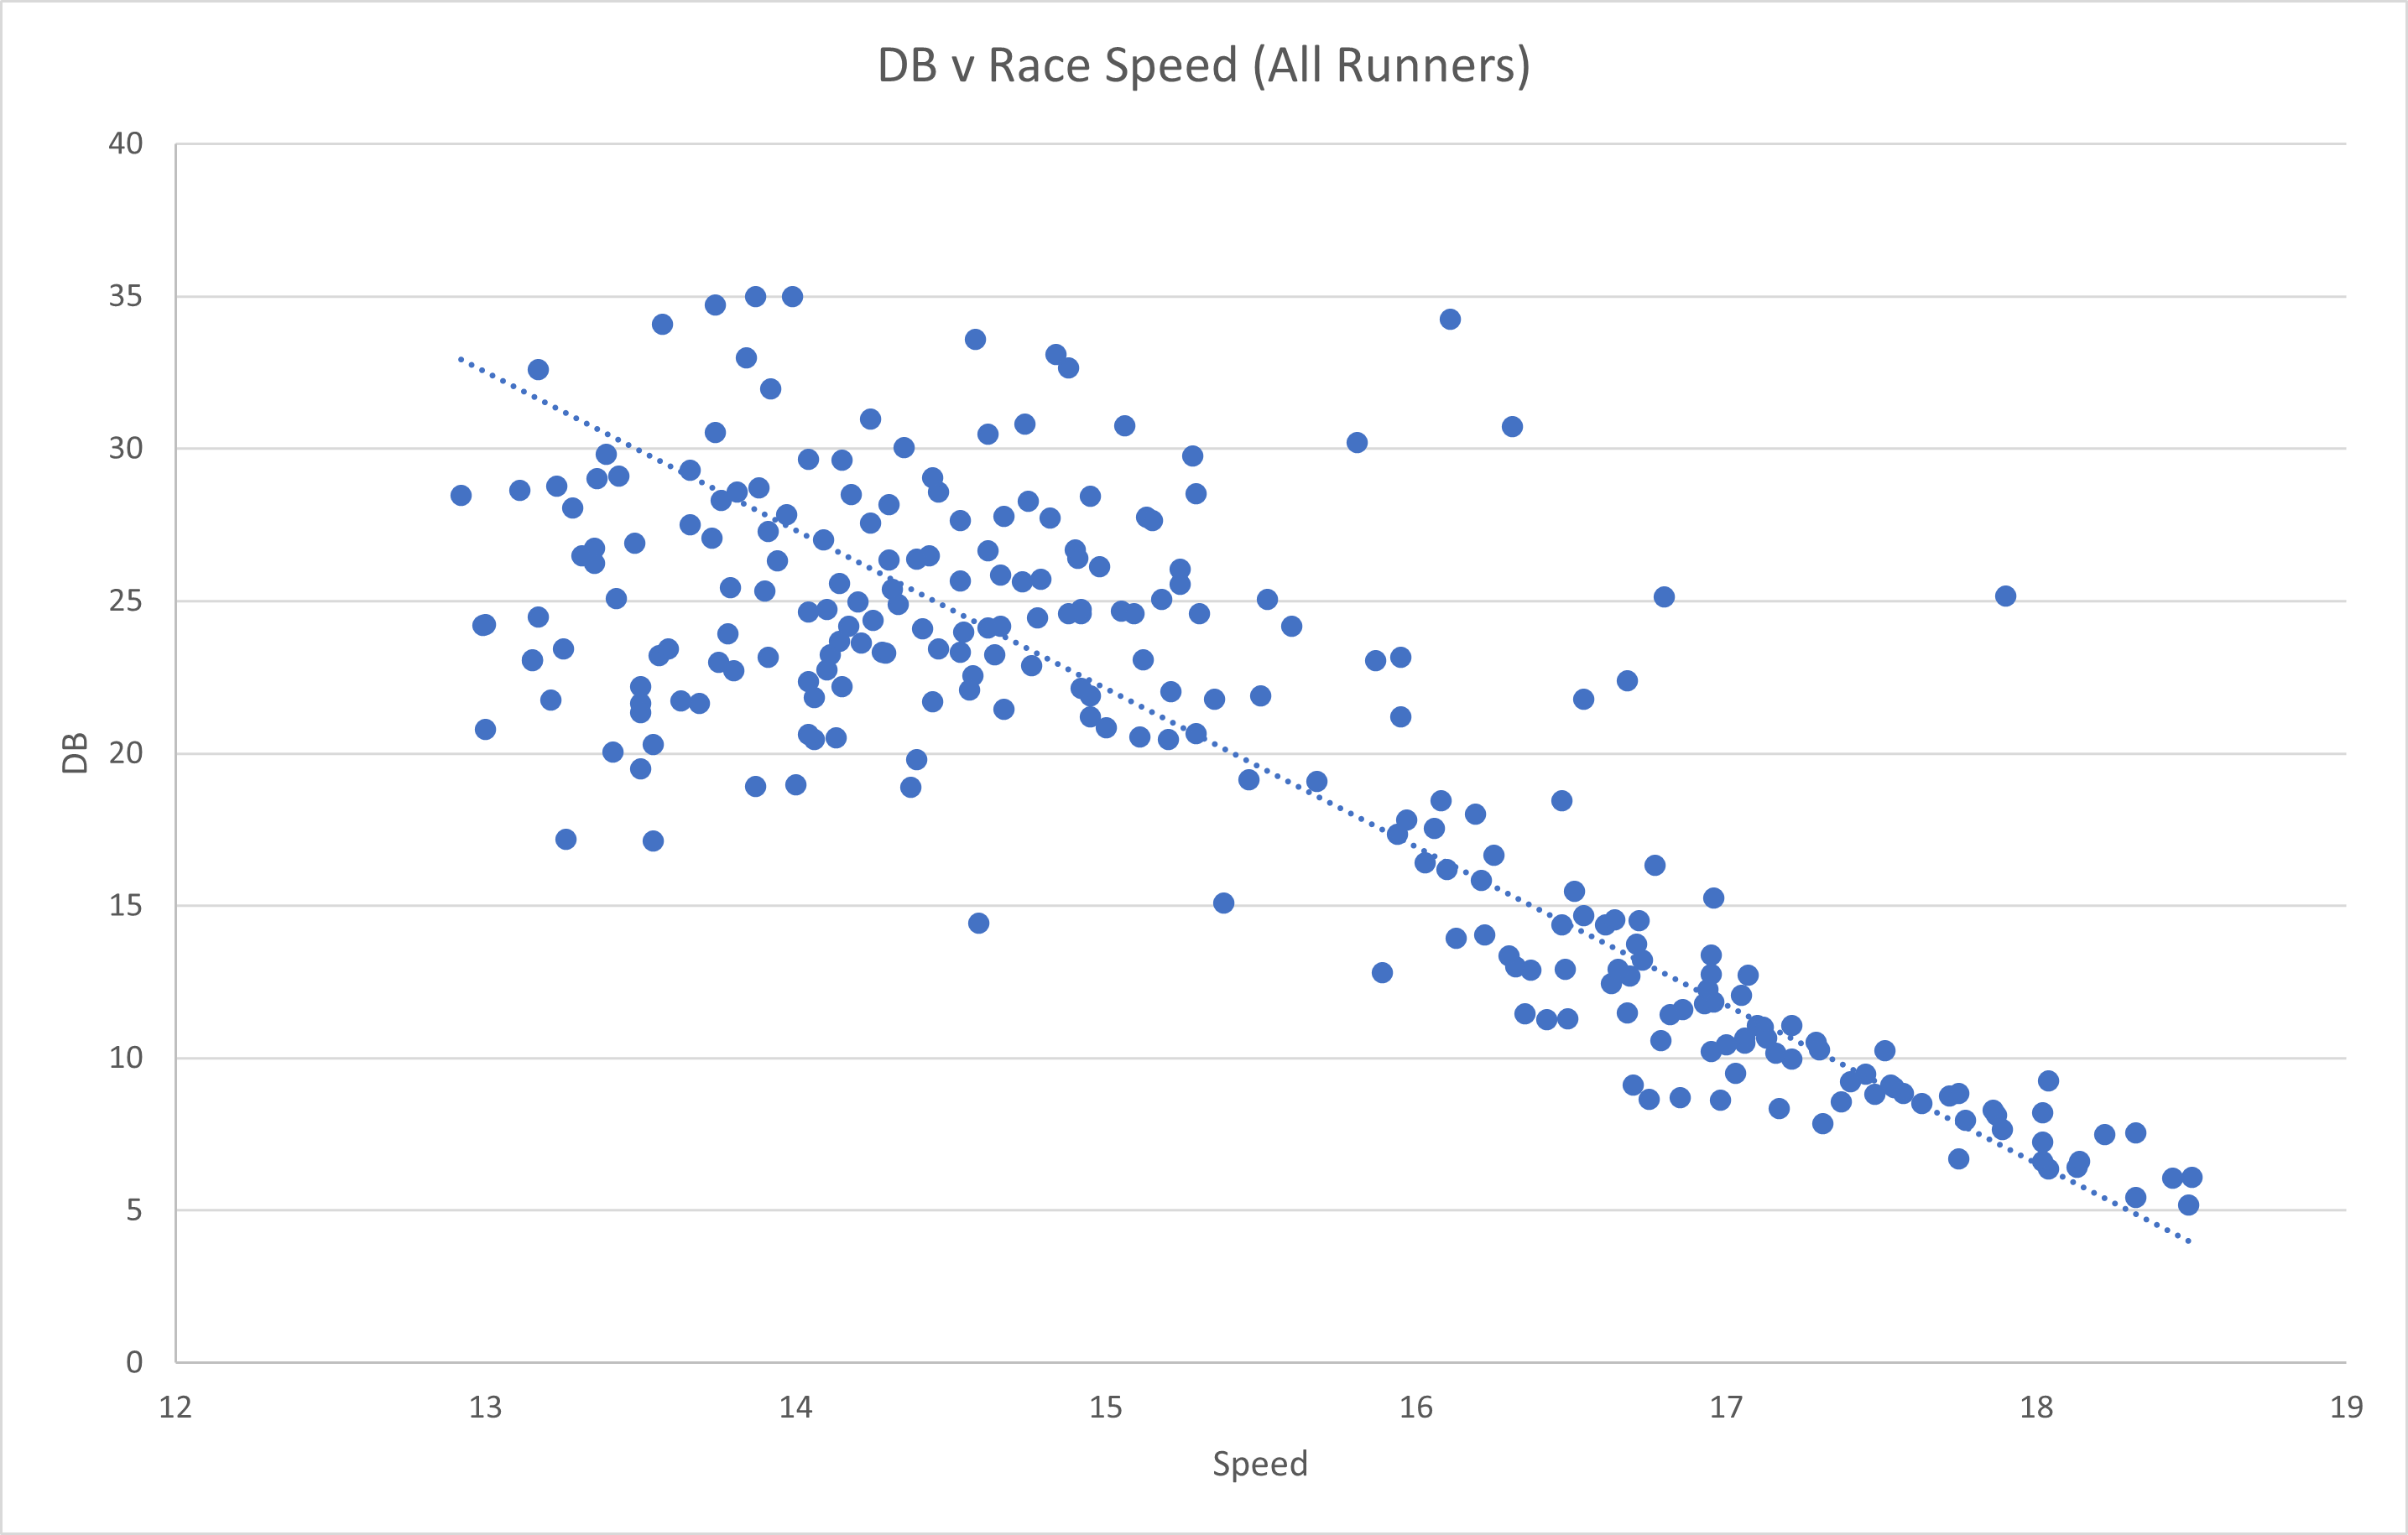
Interestingly enough, for just 2nd position the trend is not linear. Also worth a note is the apparency of 2 islands of speeds, 1 centered around 14 and the other 17.5 or so m/s, each with different traits - the relationship could be linear if we separate into crude 2 groups of fast and slow races.

This is a rabbit hole I don't want to follow much further as it's already evident the difference in TDB is significantly determined by race speed. We cannot say our horse is 69% in ranking without adjusting for the race speeds it been running in. It could be being compared to horses having ran in shorter races.
The impact of comparing horses ADB without race speed consideration might not be as bad as all that, we are generally going to be comparing apples with apples. A marathon horse will never be up against a sprint horse for example, but its worth looking at how similar the apples in the basket can be!
TODO:
Variance of average race speed of horse past runs in a race
Slowed up
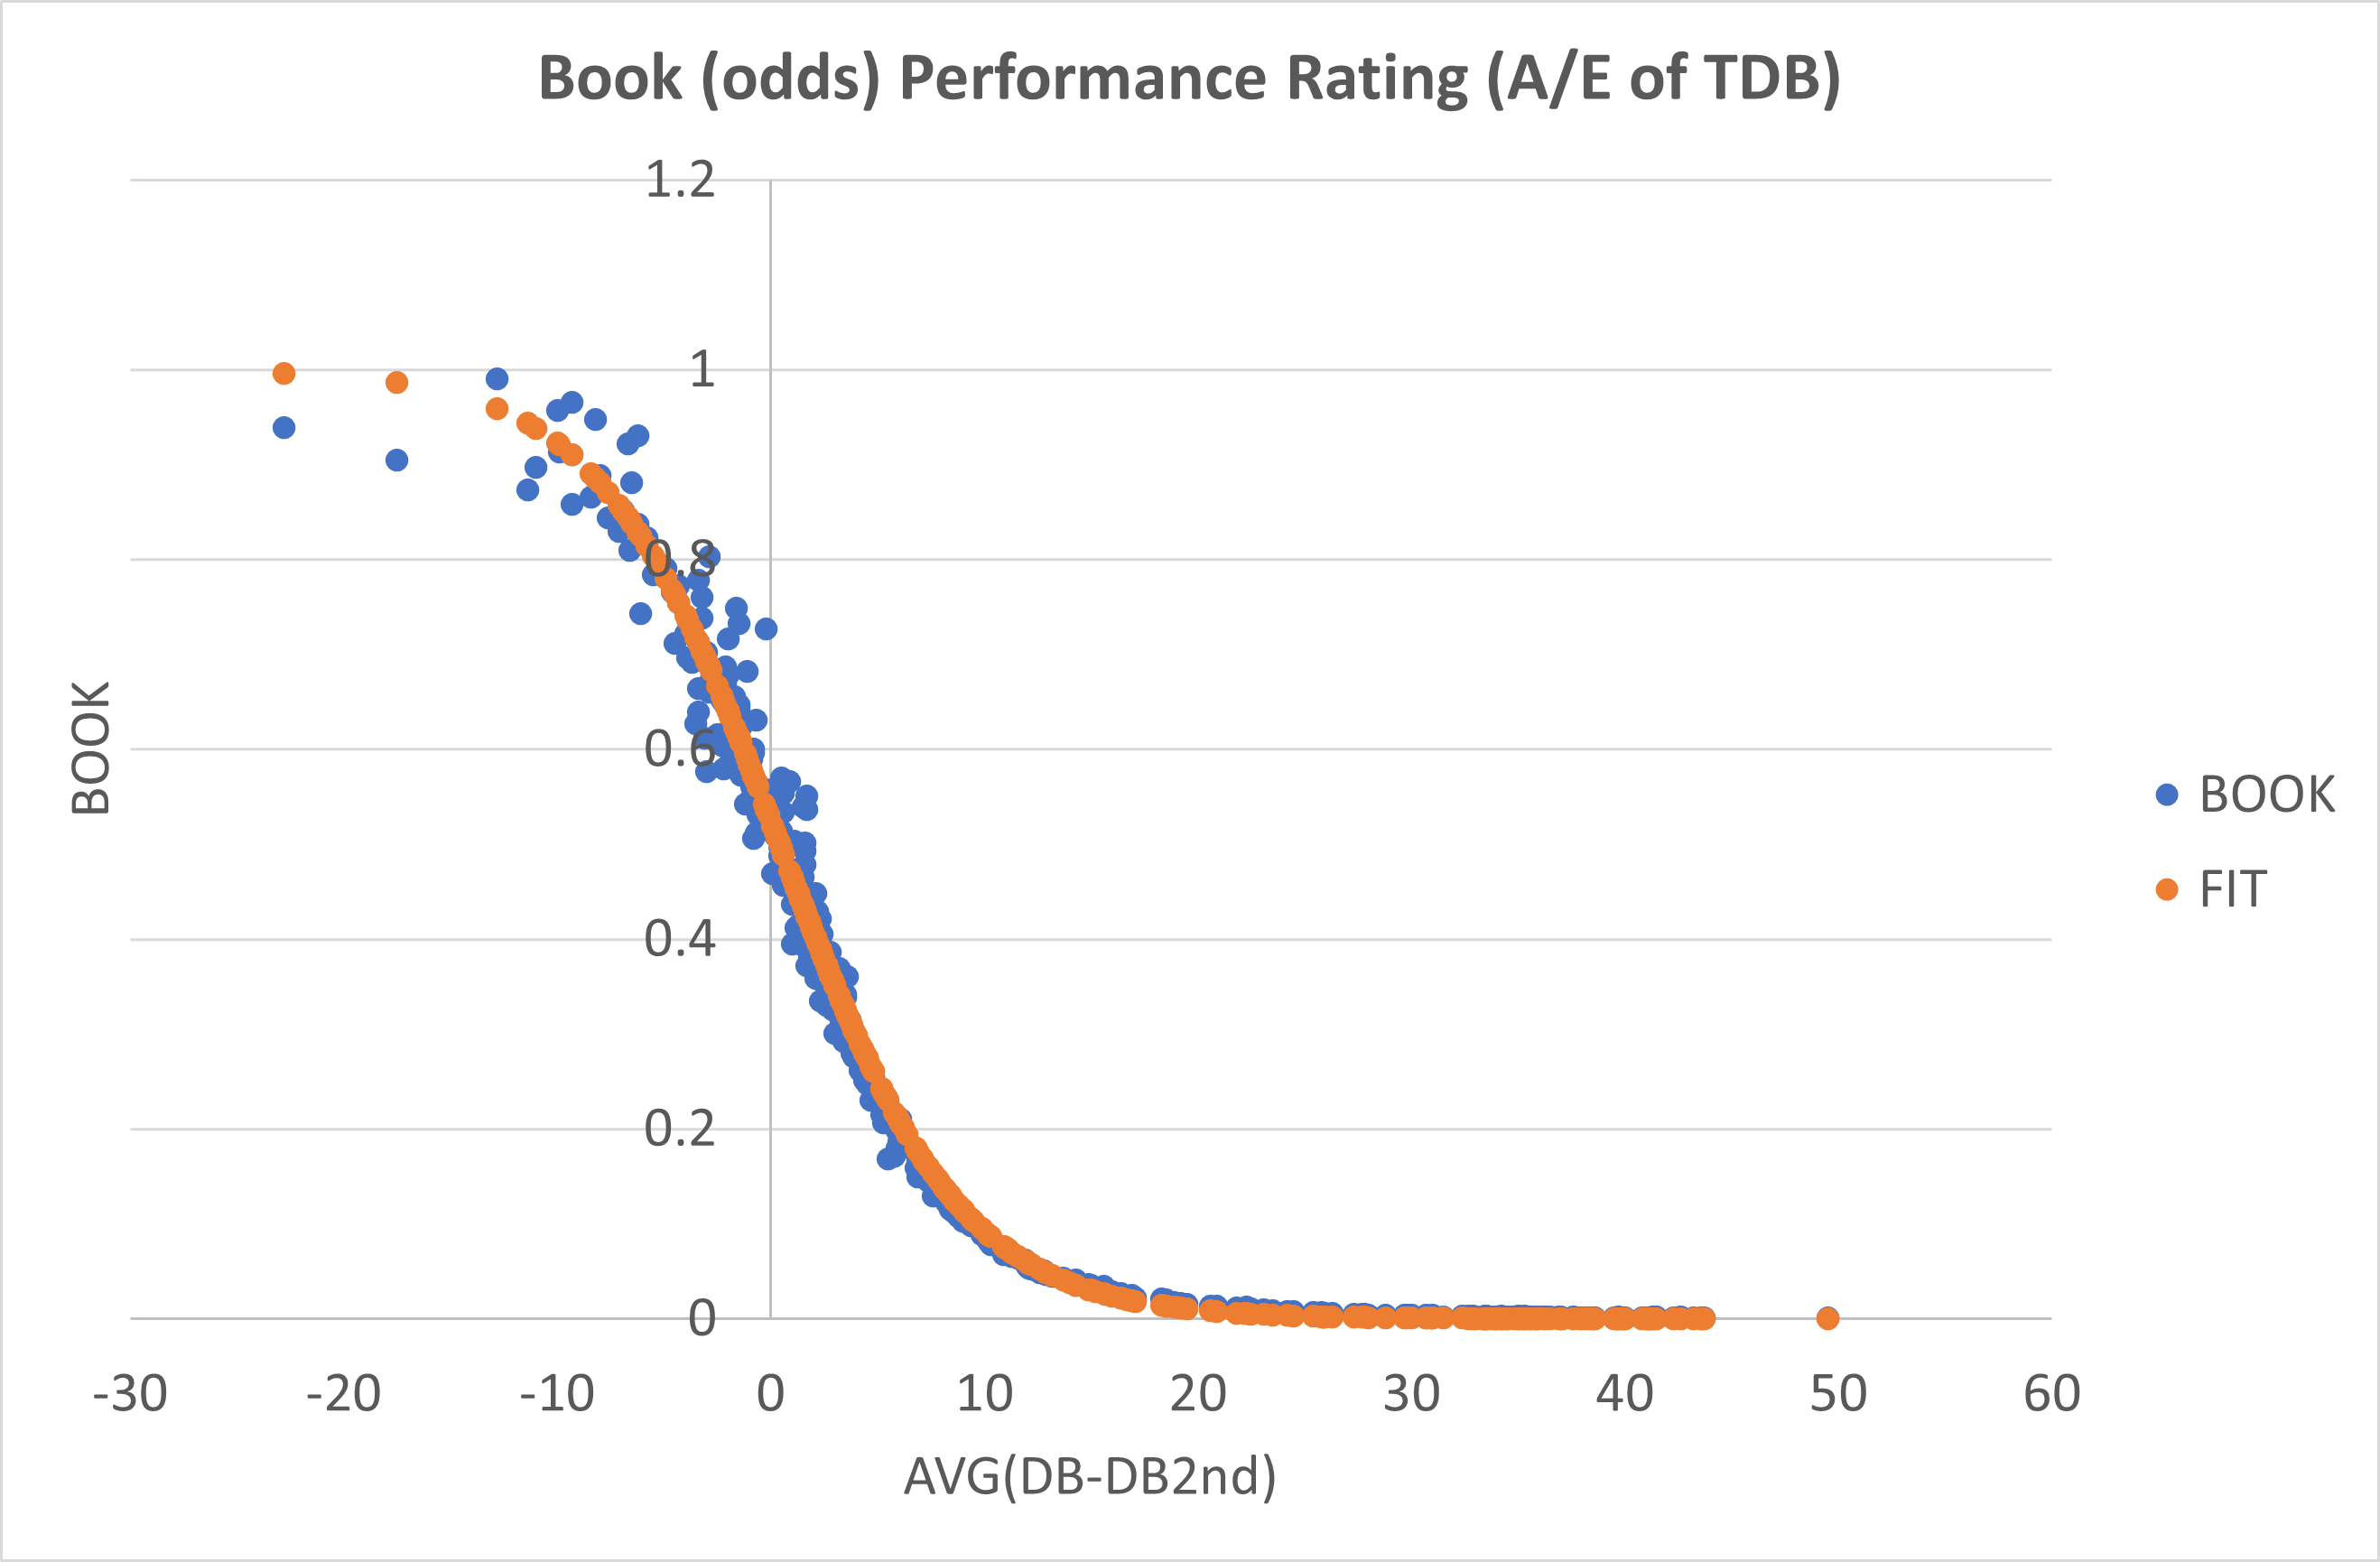
A runners Total Beaten Distance can also give us a measure how how well it did compared to how well it was expected to do. Grouping runners by odds and plotting relationship between each odds group (BF ticks) and beaten distance of that group gives us some interesting results
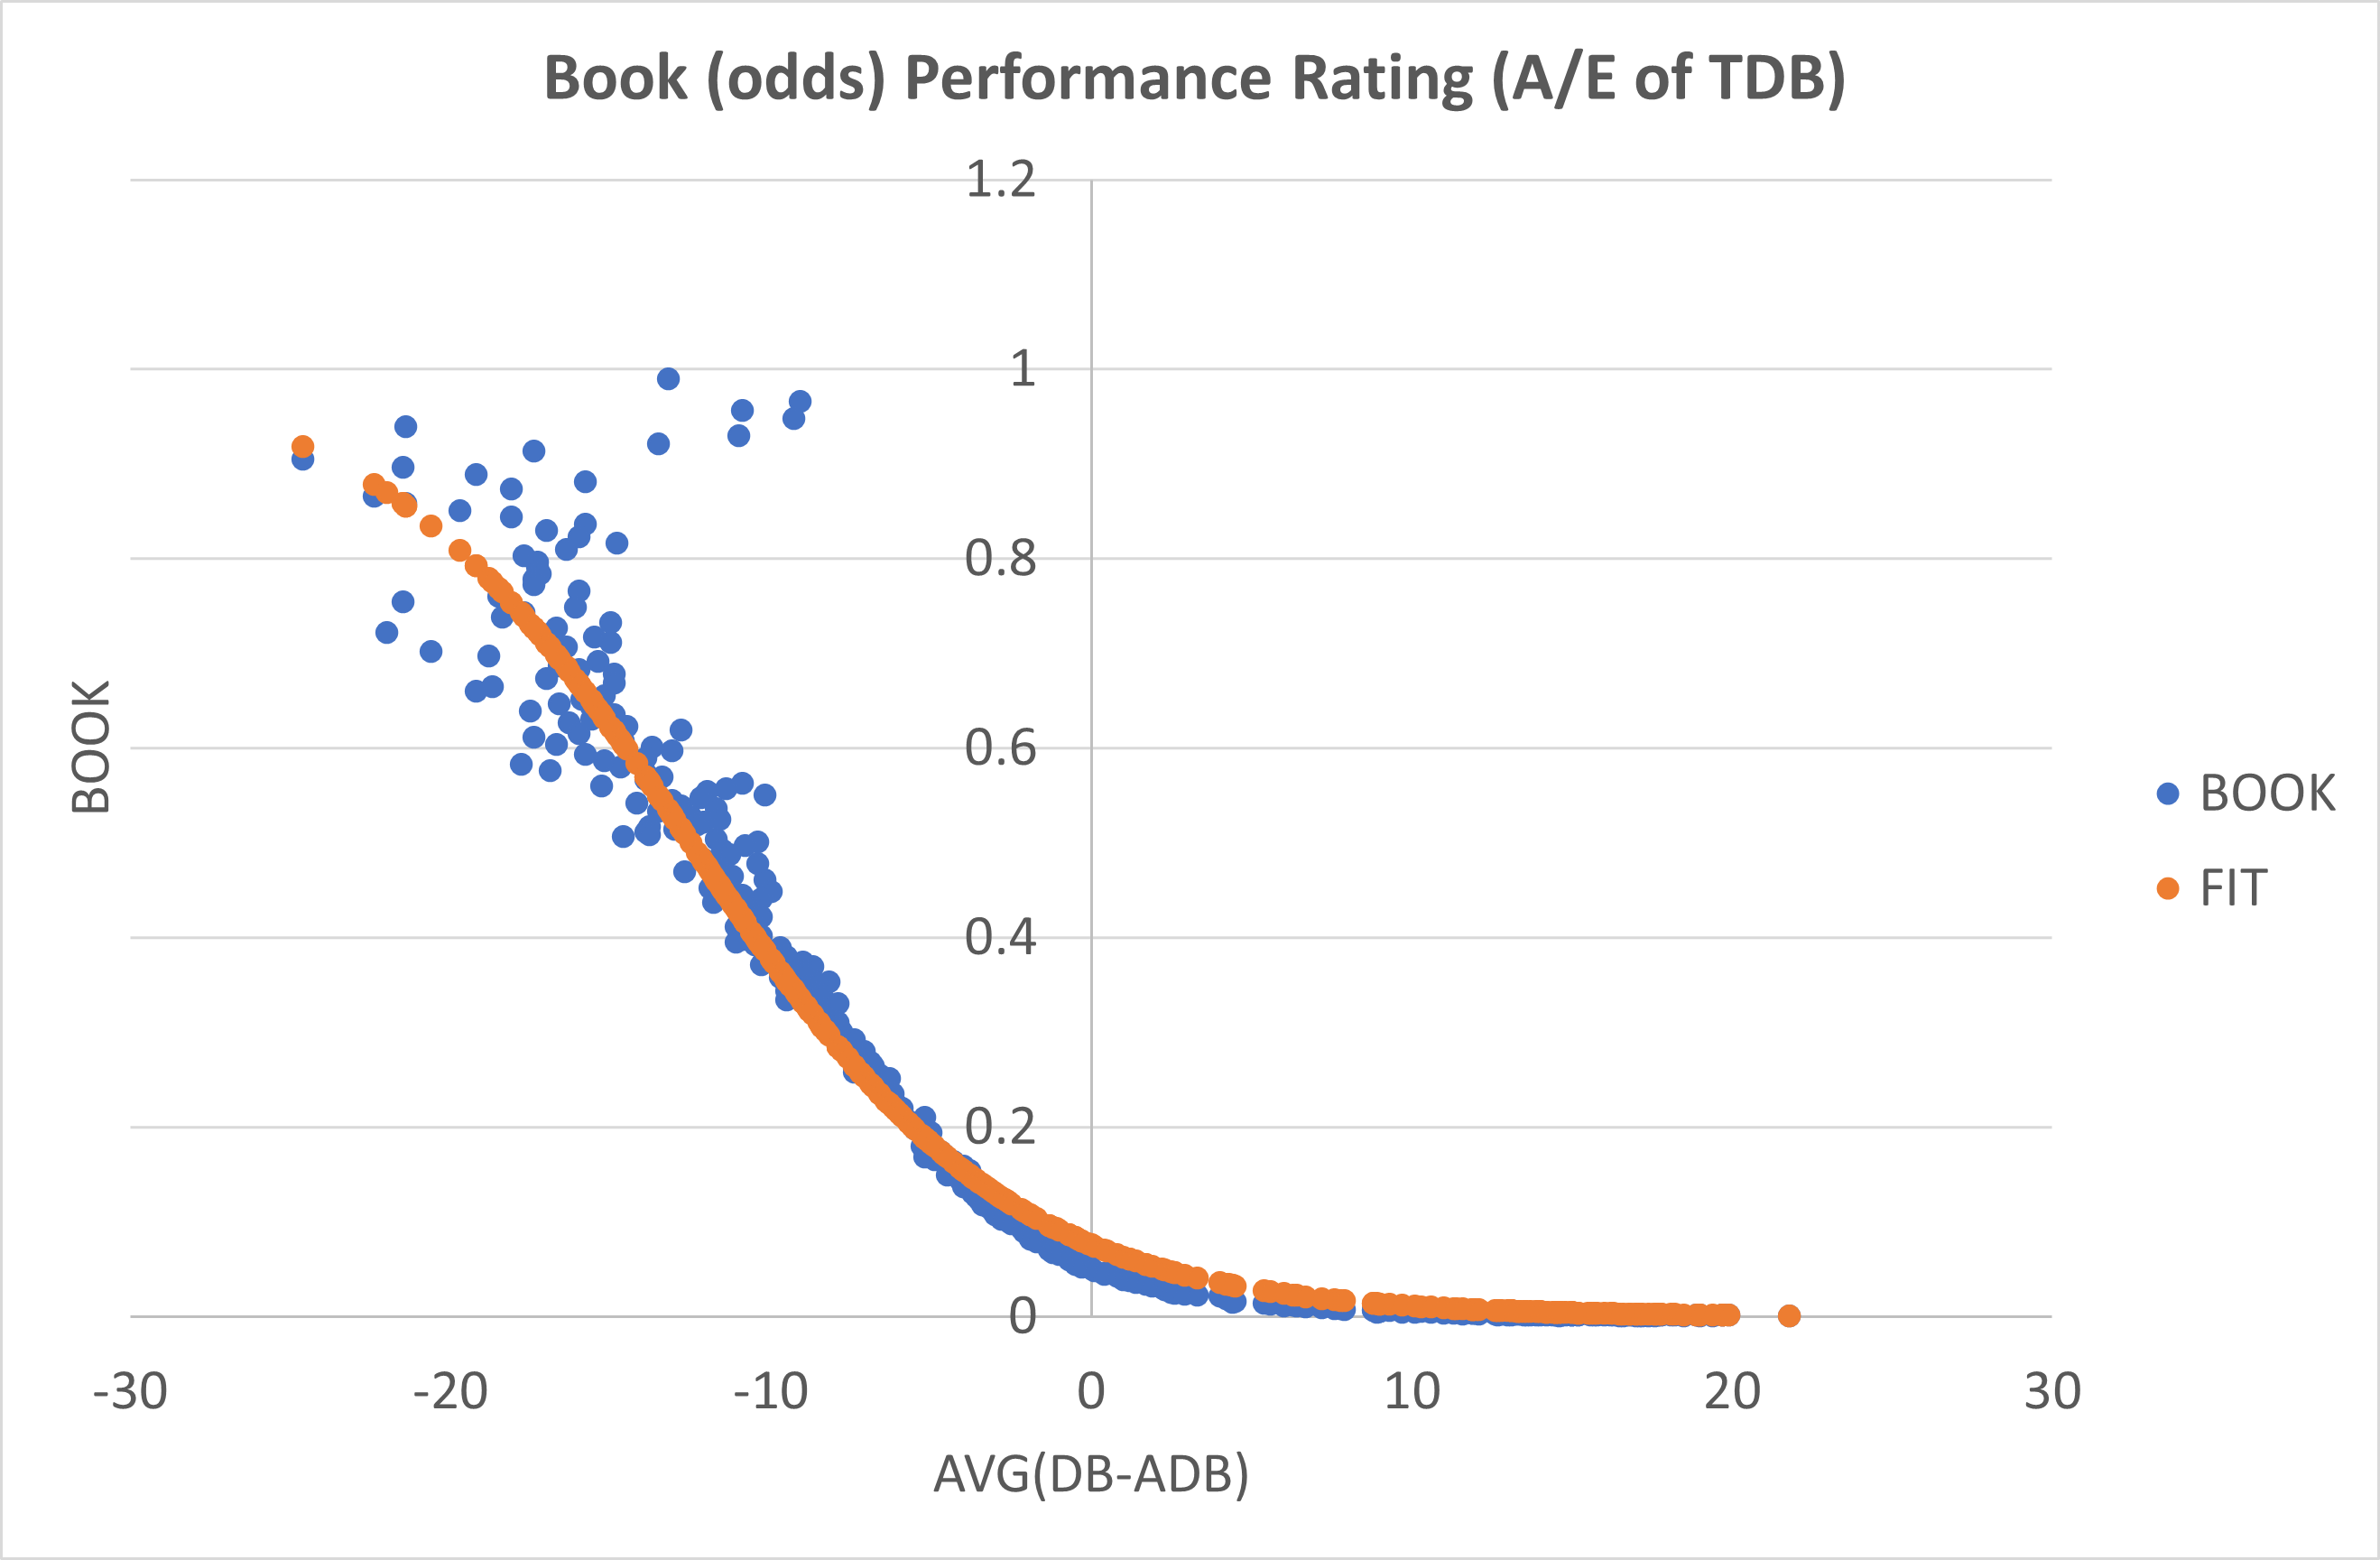
Each runner's value here is its distance beaten - the packs average distance beaten which fits a Boltzmann equation best fit very nicely.
Blah...
What next for ratings with regard to ADB for a %till rating and colour gradient to highlight good / bad