
Overview
The Research Tool
Build winning horse racing strategies visually — before you risk a penny.
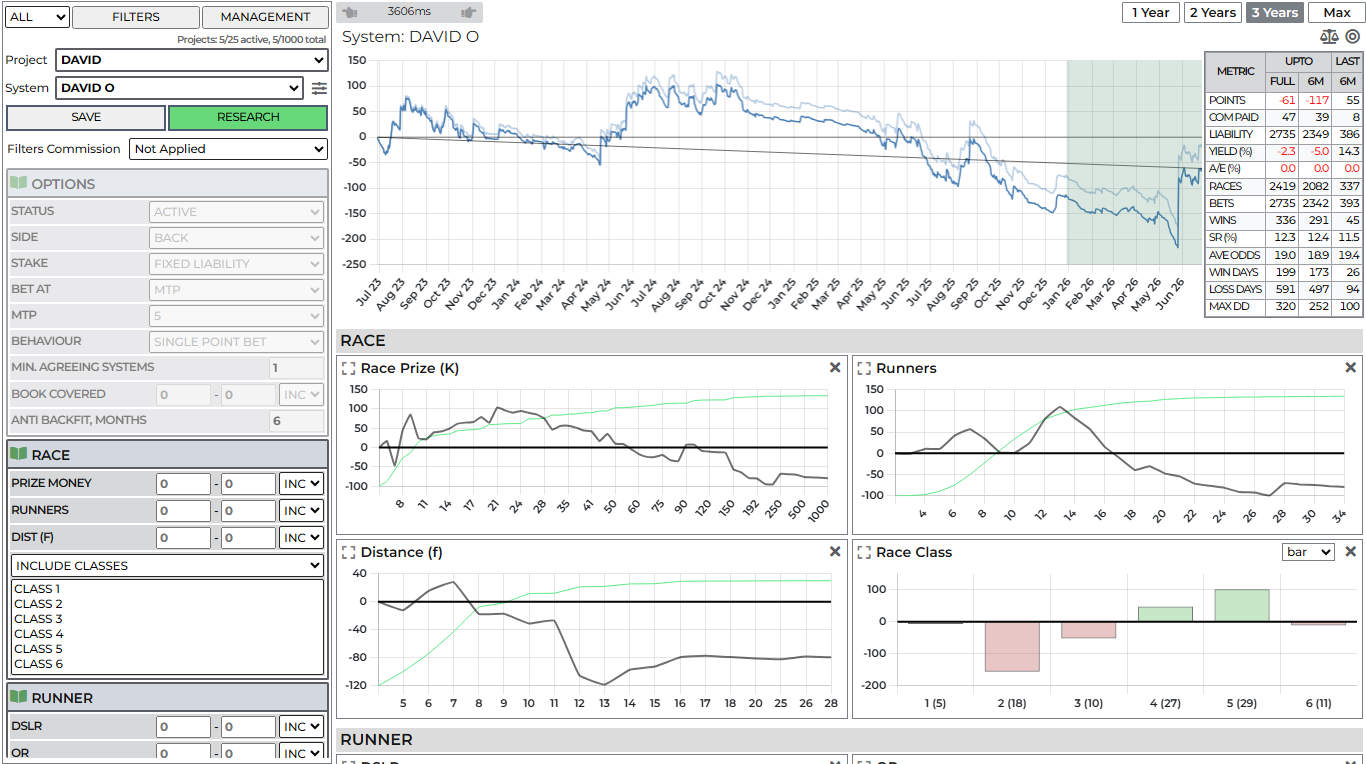
The RESEARCH tab is Hedger Pro’s graphical strategy laboratory. In traditional betting, finding an edge often means wrestling with spreadsheets or guessing which filters might work. Hedger Pro turns this on its head: you see the profitability of every angle directly on interactive charts — odds bands, draw, going, courses, jockey form, and price movements.
When you spot a profitable pattern, save it with a single click. Your winning angles automatically generate live shortlists and qualifiers on the Cards tab on race day.
Why Graphical Research Gives You the Edge
- Spot Winning Angles in Seconds: Instead of staring at rows of numbers, intuitive bar charts, line graphs, and tables immediately reveal where profit trends upward.
- Protect Against Back-Fitting: Anyone can find a formula that worked yesterday by over-tweaking filters. Hedger Pro withholds the most recent 6 months of data on filter charts by default so you can test your ideas against fresh, unseen race data.
- Effortless Scale: Manage up to 5,000 systems neatly grouped into 50 Projects.
- Seamless Race Day Action: Every saved system monitors upcoming cards automatically, flagging confirmed qualifiers and pre-qualifiers directly on your race cards.
Research layout
The RESEARCH screen is thoughtfully split into two functional areas: your settings panel on the left and your results workspace on the right.
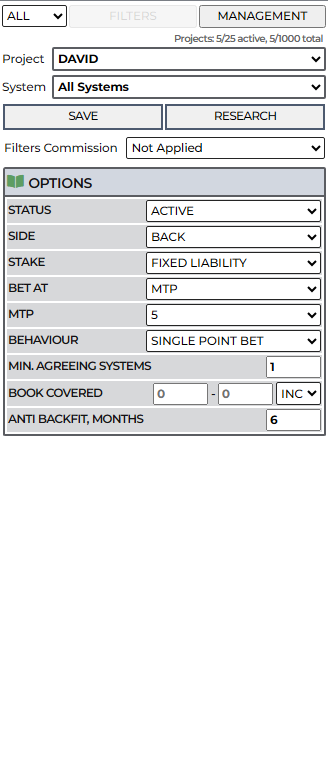
The Settings Panel (Left)
Your control centre for picking what you are researching and adjusting rules:
| Control | What It Does |
|---|---|
| Status Filter | Switch between viewing ALL, ACTIVE, or DRAFT projects. |
| Project Selector | Choose which project you want to work on. |
| System Selector | Choose an individual child system, or select All Systems to view your combined project performance. |
| System Quick Actions (≡) | Three-line menu beside the system name to quickly Save As (Duplicate), Rename, or Clean filters. |
| FILTERS Button | Toggle filter edit mode to browse and add new filter categories. |
| MANAGEMENT | Opens the Project Management hub (to create, port, sample, combine, or back up projects). |
| SAVE | Saves your current filter settings to the selected system or project. |
| RESEARCH | Runs the query against our historical database and updates your charts and stats. |
| Filters Commission | Lets you toggle whether chart points include or exclude betting exchange commission. |
| OPTIONS | Project-level settings (Back vs Lay, MTP, Staking mode, Book Covered, Anti-backfit window). |
| Active Filter Blocks | Collapsible cards for every filter currently active on your system. |
The Results Area (Right)
When you first open Research on a blank system, a helpful empty state guides you. Once you run RESEARCH, the right side comes to life:
- P&L Summary Toolbar: High-level metrics showing total points profit, yield (ROI), win strike rate, and maximum drawdown for both the full historical period and the recent anti-backfit test period.
- Main P&L Line Chart: A cumulative profit graph showing your strategy’s equity curve over time.
- Filter Category Charts: Visual bar charts, line plots, and breakdown tables for each active filter.
- Project Breakdowns: When All Systems is selected, this area displays multi-system crossover tables, staking behaviour comparisons, and Minutes to Post breakdowns.
Collapsible Filter Boxes
To keep your workspace clean and prevent endless scrolling, every active filter block can be collapsed or expanded by clicking its header. Active filters with selected values highlight neatly so you can always see at a glance what is shaping your system.
Screenshot pendingCollapsible filter boxes on the left rail
/snagged/research/research-filters-collapsible.pngMobile & Tablet View
When working on smaller screens or tablets (below ~800px width), the settings panel automatically tucks away off-screen to give your charts maximum breathing room. Simply tap the Show Settings button at the top to slide the controls in, make your tweaks, and tap × to close them.
Projects & systems
Understanding Projects and Systems
In earlier versions of Hedger Pro, managing a large number of individual systems could become unwieldy. Version 2.0 introduces an elegant hierarchy: Projects and Systems.
- A Project is a collection of related betting systems that share the same core rules.
- A System is an individual angle or filter set sitting inside that project.
You can have up to 50 Active Projects, and each project can hold up to 100 Systems — giving you the power to run up to 5,000 systems simultaneously!
Screenshot pendingProject and system hierarchy dropdowns
/snagged/research/research-projects-and-systems.pngCore Project Rules
To keep your portfolio organized and ensure automated betting runs safely, every system within a single project must agree on key foundational settings:
- Side: All systems in a project must be BACK or all must be LAY.
- Minutes to Post (MTP): All systems in a project trigger at the same cutoff time (e.g. 1 MTP, 5 MTP, etc.).
- Stake As: Fixed Liability or Fixed Profit.
- Bet Mode: Exchange BSP or MTP price.
If you have a group of lay systems you want to trigger at 1 MTP, you put them all inside one project (e.g. "All Weather Lay 1 MTP"). If you want to create a backing system at 5 MTP, you simply create a separate project for it.
Active vs Draft Projects
Every project has a status:
- Draft: An unlimited sandbox where you can build, tinker, and test new ideas in the background. Draft projects do not place live bets, and their qualifiers show as greyed-out outlines on historical race cards.
- Active: When you are delighted with a project's performance, toggle its status to Active and click Save. It immediately becomes available in your Portfolio for live betting and tracking.
Building systems
Step-by-Step: Creating a New System
Building a new strategy from scratch is fast and intuitive:
- Go to MANAGEMENT > New > New.
- Give your project a name (e.g. "Sprint Handicap Back") and name your first system (e.g. "Class 3-4 5F"). Click Create.
- Your project starts in Draft mode so you can experiment safely.
- Set your core project options under OPTIONS (Back or Lay, MTP, etc.).
- Click FILTERS to open the filter picker. Tick the categories you want to explore — such as Course, Race Class, Distance, Runner Age, or Odds.
- Click RESEARCH to pull historical data.
- Click directly on the resulting charts to select winning zones.
- When satisfied, click SAVE.
Screenshot pendingBuilding a new system and adding filters
/snagged/research/research-system-building.pngSetting Your Default Filters
If you find yourself always adding the same standard filters every time you create a new system (for example: Course, Race Class, Distance, and Odds), you can save them as your defaults:
- Go to MANAGEMENT > Defaults.
- Tick the filter boxes you always like to see on a fresh system.
- Click Save Defaults.
Every time you create a new system in the future, your favourite filters will already be open and waiting for you!
Filter charts
How to Read and Use the Charts
Hedger Pro uses visual charts to show you where the money is made. Rather than guessing numerical thresholds, you simply look for where profit is climbing.
Screenshot pendingBar charts, line graphs, and tables side by side
/snagged/research/research-charts-types.png1. Bar Charts
Bar charts are used for distinct categories — such as Race Types (Flat, Hurdle, Chase, NHF), Courses, or Days of the Week.
- Each vertical bar represents the points profit or loss for that category.
- Click any bar to toggle it on or off. When selected, the bar highlights and your system will only include runners matching that category.
- Look for strong, consistent positive bars and avoid categories that consistently lose points.
2. Line Charts
Line charts are used for continuous numbers with many values — such as Betfair Starting Price (BSP) odds, official ratings, or runner draw.
- Just as a company's share price graph trends up or down over time, our line charts plot cumulative profit across the numerical range.
- The area of interest is where the curve slopes upward.
- Click and drag across the chart to select your desired range (for example, selecting odds between 3.0 and 12.0). The left settings panel will automatically update to match your selection.
3. Data Tables
You can switch any chart into a detailed data table using the table toggle icon in the chart header:
- Tables provide deeper metrics for each category: Runs, Wins, Win Strike Rate (SR%), Points Profit, and Yield (ROI%).
- Check or uncheck the INC checkbox beside any row to include or exclude that item.
The 2.0 research toolkit
Advanced 2.0 Research Tools
Version 2.0 introduces four breakthrough research tools designed to save you hours of work and give you unprecedented confidence in your strategies.
1. The Slice Tool {#slice-tool}
Have you ever wondered which individual racecourses or race classes are driving your system's profit? In the past, you had to test each course one by one — a tedious, time-consuming chore.
The Slice Tool solves this instantly:
- Click the Slice icon (the stacked lines icon) on any multi-category filter (e.g. Course, Race Class, or Country).
- The Slice panel opens, breaking that filter down into its constituent parts side-by-side.
- You can see the exact runs, wins, strike rate, yield, and profit for every single course or class at a glance!
- Click any item in the left list to isolate and inspect its individual performance curve.
Screenshot pendingResearch Slice Tool breaking down racecourses
/snagged/research/research-slice-tool.png1-Click System Creation from Slices
Even better: inside the Slice Tool, click Actions. You can automatically split your winning slices into separate systems!
For example, if you have an All-Weather project and you want each course to have its own tailored system, select your 8 courses, choose Create Systems, and Hedger Pro will instantly generate 8 separate systems inside your project (one for Wolverhampton, one for Lingfield, one for Kempton, etc.). You can then fine-tune each course individually.
Screenshot pendingActions menu inside the Slice tool for auto-generating systems
/snagged/research/research-slice-actions.png2. The Baseline Tool {#market-baseline}
When designing a betting system, it is crucial to know: Is my filter actually adding value, or am I just riding general market noise?
Click the Baseline icon on the chart toolbar:
- A dotted line appears on your P&L graph.
- This dotted line represents the raw market baseline — for example, what would happen if you backed or laid all horses in that odds range with no other filters applied.
- If your system's solid curve climbs well above the dotted line, you have genuine confirmation that your filters are generating a real statistical edge!
Screenshot pendingP&L chart with dotted baseline comparison
/snagged/research/research-baseline-dotted.png3. The Glasses Tool (Comparison Overlay) {#glasses-tool}
When tweaking an existing, profitable system, it is easy to make a change and wonder: Did that actually make things better or worse?
Click the Glasses icon to toggle comparison mode:
- The green line represents your currently saved system (your baseline).
- The red line represents your active, modified test.
- You can now tweak filters (such as tightening the draw range or adding a distance filter) and immediately see the red line update against the green line.
- If the red line beats the green line, click SAVE to lock in your improvement. If it performs worse, you know immediately not to save the change.
Screenshot pendingGlasses tool showing green saved system vs red active test
/snagged/research/research-glasses-comparison.png4. Feature Importance & Deep Search {#filter-importance}
Hedger Pro incorporates machine-learning analysis to evaluate your systems and identify what matters.
Click Analyse Feature Importance:
- Importance Ranking: Hedger Pro analyzes all filters applied to your system and gives each one a percentage importance score.
- If Odds is at 45% and Draw is at 30%, those are key drivers.
- If a filter shows 0%, it is contributing no meaningful statistical value and can be safely removed to keep your system clean.
- Deep Search (Discover Mode): Click Discover Mode in the importance window. The system scans all available filters in the database that you haven't used yet, highlighting candidate filters that could significantly boost your system's profitability!
Screenshot pendingFeature Importance ranking dialog
/snagged/research/research-feature-importance.pngScreenshot pendingDiscover Mode table suggesting new filters
/snagged/research/research-discover-mode.pngProject options
Project-Level Options & Behaviour
When you select All Systems in the left rail and open OPTIONS, you access settings that govern how the entire project behaves:
Screenshot pendingProject options and analysis tables
/snagged/research/research-project-tables.png1. System Crossover Matrix
If you have several systems in one project, do they pick the same horses?
The System Crossover table displays an overlap percentage between every pair of systems in your project. If System A and System B have an 85% overlap, you may want to consolidate them or adjust their filters to prevent redundant selections.
2. Staking Behaviour (Single vs Multi-Point)
What should happen if two different systems in your project qualify on the very same horse?
- Single Point Bet (Default): Places one standard stake regardless of how many systems agree.
- Multi-Point Bet: Multiplies your stake by the number of agreeing systems (e.g. if 2 systems qualify on the runner, it places 2 points). This lets you naturally stake more heavily on your highest-conviction selections.
3. Minimum Agreeing Systems
Want ultra-selective qualifiers? Set Min Agreeing Systems to 2 or more. The app will only bet on runners where multiple systems in your project independently agree.
4. Minutes to Post (MTP) Analysis
The MTP table compares your project's historical profitability at different time intervals before the off (e.g. 15, 10, 5, or 1 minute before post). This allows you to verify that your chosen MTP represents an optimal liquidity and pricing sweet spot.
5. Book Covered Cap % {#book-covered}
The BOOK COVERED feature allows you to cap total market liability:
- Set a percentage cap (e.g. 40%) and choose Odds Ascending or Odds Descending.
- In Odds Ascending, the system begins with the favourite and adds qualifiers moving upward in odds until the cumulative market percentage hits your cap, cutting off the high-odds longshots.
- This protects you against laying extreme longshots that rarely win but carry massive liability if they do.
Screenshot pendingBook covered cap and sorting controls
/snagged/research/research-book-covered.png6. Project-Level Filters
If all systems in your project share the exact same filter rule (for example, every system in an All-Weather project restricts runner draw to 1–5), you don't need to enter it on every child system.
Select All Systems, add the filter, set your value, and click SAVE. That filter becomes a Project-Level Filter. It applies automatically to all systems in the project and is tucked neatly away so individual child system editors stay simple.
System quick actions
System Quick Actions Menu (≡)
Beside the System selector in the left settings rail is a convenient three-line menu icon (≡). This provides fast shortcuts while building projects:
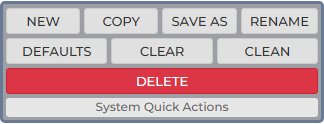
- SAVE AS (Duplicate): Clones your currently selected system into a brand new system under the same project. This is the fastest way to test variations of a winning strategy without touching your original.
- RENAME: Quickly change the system's name in place.
- CLEAN: Clears all active filters from the system, giving you a fresh, clean slate without having to delete and re-create it.
- DEFAULTS: Instantly restores your saved default filter set.
P&L and stats
Understanding P&L and Performance Stats
The top toolbar and stats table provide a comprehensive financial health check for your strategy:

| Metric | What It Tells You |
|---|---|
| Points | Total cumulative profit or loss expressed in betting points. |
| Yield (ROI%) | Profit divided by total staked. A healthy positive yield indicates sustainable profitability. |
| Bets / Runs | Total number of qualifying bets over the selected period. |
| Wins & Strike Rate (SR%) | Percentage of bets that won. |
| Average Odds | The average BSP odds of your qualifiers. |
| Max Drawdown (DD) | The deepest peak-to-trough decline your bankroll would have experienced. Crucial for bankroll management! |
The Anti-Backfit Window
Hedger Pro displays your performance across two distinct periods:
- Full Period: Lifetime historical results.
- Anti-Backfit Window (Default: Last 6 Months): Recent data withheld from filter charts.
If a system shows tremendous lifetime profit but drops steeply over the last 6 months, it may be suffering from over-fitting to old market conditions. Look for systems where the recent test curve continues the healthy upward trajectory of the lifetime curve.
Save & search
Running Research and Saving Changes
- RESEARCH Button: Submits your current filter values to the database. Results typically return in a couple of seconds.
- SAVE Button: Commits your changes to memory and disk. Always ensure you click SAVE after refining a system so your live qualifiers on the Cards tab update.
- History Strip: Above the main charts, a search history strip logs your recent test iterations. You can click any previous step to jump back if a new filter experiment didn't work out.
Backing up & restoring systems
Backups, Export & Restore
Never worry about losing your hard work. Hedger Pro provides both manual export and automatic cloud snapshots:
Screenshot pendingRestore dialog showing file upload and automated snapshots
/snagged/research/research-backup-restore.png1. Manual File Export
- Open MANAGEMENT and go to Export.
- Select your Project (or an individual system within it).
- Click Export to download a clean JSON configuration file to your computer.
2. Restoring from File
- In MANAGEMENT, go to Restore > From File.
- Choose your saved file.
- Choose whether to Replace Project, Add to Existing Project, or Create New Project.
3. Automated Server Backups
Every time you save an active system, Hedger Pro automatically logs a timestamped snapshot on the server:
- Go to MANAGEMENT > Restore > Automated Backups.
- Browse your past saves by date and time.
- You can restore an entire project or revert a single system that you may have accidentally altered.
Filters overview
Complete Filter Reference Guide
Hedger Pro offers an extensive library of race, runner, form, and market filters. All filters support inclusion, exclusion, or range selection.
Race & Dates Filters {#filter-reference-race-and-dates}
- Course: Multi-select UK and Irish racecourses.
- Race Classifications: Handicap, Maiden, Novice, Group/Grade 1–3, Listed, Nursery, Selling, Claiming, etc.
- Race Class: Class 1 through Class 6.
- Distance: Race distance in furlongs (e.g. 5F sprint up to 24F+ marathon).
- Surface & Going: Turf (Firm to Heavy) or All-Weather (Fast to Slow).
- Country: Great Britain (GB) or Ireland (IE).
- Race Codes: Flat, Hurdle, Chase, or National Hunt Flat (NHF).
- Field Size & Race #: Total runners in the race and race card sequence number.
- Dates & Time: Day of the week, Month of the year, Morning vs Evening meetings, and race hour.
Runner & Form Filters {#filter-reference-runner-and-cards}
- Age & Weight: Runner age in years and carried weight in stones/pounds.
- Gender & Sex: Colt, Gelding, Horse, Filly, Mare, Rig.
- Country Born: GBR, IRE, FR, GER, USA, etc.
- Official Rating (OR): Current official handicap mark.
- Days Since Last Run (DSLR): Measure of freshness or quick turnaround.
- Course & Distance Wins: C Win, D Win, or CD Win (horse has won at this course, this distance, or both).
- Draw: Starting stall number (vital for all-weather sprint handicaps).
Last Time Out (LTO) Filters {#filter-reference-lto-and-prices}
- LTO Position: Finishing position in the previous race (1st, 2nd, 3rd, etc.).
- LTO DNFs: Pulled Up (PU), Fell (F), Unseated Rider (UR).
- LTO BSP & Odds Rank: Starting price and market rank in the previous race.
- LTO Class & Distance Diff: Moving up or down in class, or stepping up/down in distance compared to last run.
- LTO Weight Diff: Change in carried weight since the last outing.
Prices & Betting Market Filters {#filter-reference-lto-and-prices}
- ODDS (BSP): Betfair Starting Price range (e.g. 2.0 to 10.0).
- ODDS RANK / FAVS: Market rank (1st Favourite, 2nd Favourite, 3rd Favourite, etc.).
- BETS PER RACE: Caps how many qualifiers your system can take in a single race (e.g. max 1 bet per race).
- BOOK COVERED: Caps total percentage of the betting book taken by your system.
- Market Volume: Traded exchange volume at race and runner level.
- WAP, PRD, POP, HP: Weighted average price, predicted price, price opportunity, and hedge potential metrics.
Entity Stats Filters {#filter-reference-stats-and-performance}
Track the historical strike rates and form of participants over custom lookback windows (4W, 8W, 12W, 26W, 52W, ALL):
- Horse Stats: Lifetime and recent form statistics for the horse.
- Jockey Stats: Winning strike rates, ride volume, and form.
- Trainer Stats: Stable form and winning strike rates.
- Trainer & Jockey Combo (TJC): Synergy stats when a specific jockey rides for a specific trainer.
- Performance Metrics (PM / TPD): Total Performance Data tracking stride length average (SLA), stride frequency average (SFA), and mechanical performance where tracking chips are active.
Tipsters & Report Profiles {#filter-reference-report-and-tipsters}
- Tipsters: Filter by national newspaper and online racing tipsters (e.g. Spotlight, Templegate, Newsboy, Rory Delargy, etc.), tipster counts, and Nap selections.
- Report Profiles: Filter runners by custom entity profiles created inside the Stats Reports app (e.g. tracking your favourite in-form jockeys or trainers).