 HedgerPro User Guide
Overview
Cards is the race-day screen. The projects you saved in Research, the runners that match them, and the Betfair slip are in one place.
Tick the projects you want to follow, scan the qualifiers, open a horse, and place or schedule a bet without leaving Hedger Pro. The samples on this page use a fixed set of races. They are not today’s card.
- View today card, or one from a past date.
- Inspect qualifying runners from one or more projects.
- Open races one by one, or a project shortlist.
- Read a horse’s previous runs, its minutes-to-post prices, and the stats behind the project.
- Place a back, a lay, a starting-price bet, or a hedge.
Projects & Races
The left panel is your control hub for dates, project shortlists, and race meetings, its shows a date picker (with refresh icon), a filter option, projects and races.
Race Date
Todays date is automatically shown in the date picker – you may however choose a past date to view the races for that day.
If you need to refresh the cards simply click the refresh icon. RIGHT click the refresh icon to force the system to update or fully hard reload your project qualifiers (a full build takes longer).

Clicking a race or project lists the runners in the main table.
Race / Meeting Filter
Above the race list, a handy dropdown lets you filter the day’s card:
- All: Shows all scheduled race meetings.
- With Quals: Instantly hides every race that has no qualifiers for your currently ticked projects. This is fantastic on busy Saturdays with 30+ races – ticking “With Quals” immediately narrows your view to just the races where you have action.
- GB / IE: Filter exclusively to Great Britain or Irish racing.
- Specific Venue: Choose an individual course (e.g. Cheltenham or Kempton).
Your preference is saved automatically in your browser so it remains set between visits.
Project Shortlists
Under the filter is the list of saved projects. ALL is the first row. Click it for one table of every qualifier from the ticked projects.
| Control | What it does |
|---|---|
| Tick | Include that project in the counts and in ALL. |
| Project name | Open that project’s qualifiers in the main table. |
| Number | How many qualifiers the project has on this date. |
The ticks are remembered in this browser, so you do not set them again at the next login.
Race List
Under the projects, the races are in time order.
- The number beside a time is how many of your qualifiers run in that race.
- The time opens the full field.
- The Betfair icon opens that market on Betfair in a new tab.
Card Options
There are options on the the cards view that lets you customise the layout and data for your needs, they include:
Hide / Show Race List
Simply closes the race list on the left to make more room for runner data.
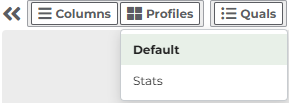
Columns
The column editor lets you choose the data you wish to see in the cards. Creating multiple named profiles makes it fast and easy to switch profiles on the cards.
Optionally you can assign profiles to a project so its automatically loaded when you view the qualifying shortlist for that project
Profiles
Quick select one of your saved layout profiles to apply to the race card table.
Pause
Pause is for one race, not for a shortlist. It marks ticked projects as inactive for that race, and leaves them on for the rest of the day. Use it when the ground, the field size, or the shape of the race is a reason to skip.
- Open the race.
- Click Pause.
- Tick the projects to skip.
- Apply.
Those qualifiers turn grey, and automatic betting skips them for that race. Every other race is unchanged.
Quals
Lists all races with total number of runner in the race, number of: static, potential and actual qualifiers. Click a race to load it in the card.
Settings
The settings dialogue lets you control basic cards layout settings:
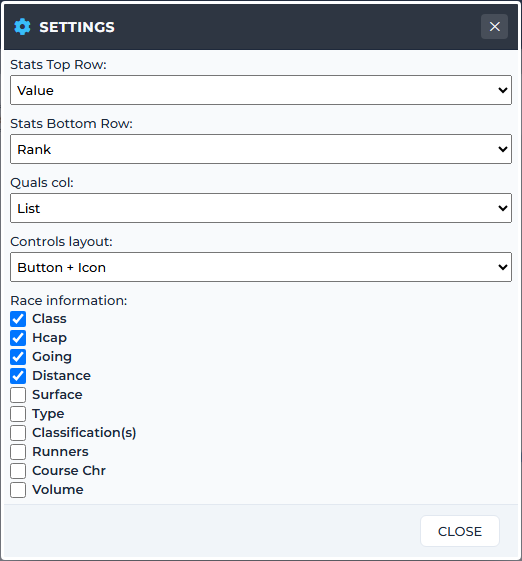
Here is a basic sample of what some of the controls do:
Stats Rows
Each stat cell in the table can display two lines of information:
- Stats Top Row
- Stats Bottom Row
You can configure each row to display any of the following modes:
| Mode | What It Displays |
|---|---|
| Value | (Top Rows Only) The raw statistical value (e.g. 24% strike rate). |
| Score | A normalized statistical score relative to the field. |
| Rank | Percentile ranking among runners in this race (e.g. 1 = highest in the field). |
| Reverse Rank | Ranked from lowest to highest. |
| None | (Bottom Row Only) Hides the bottom row entirely for a tighter, compact table. |
Quals Column Display
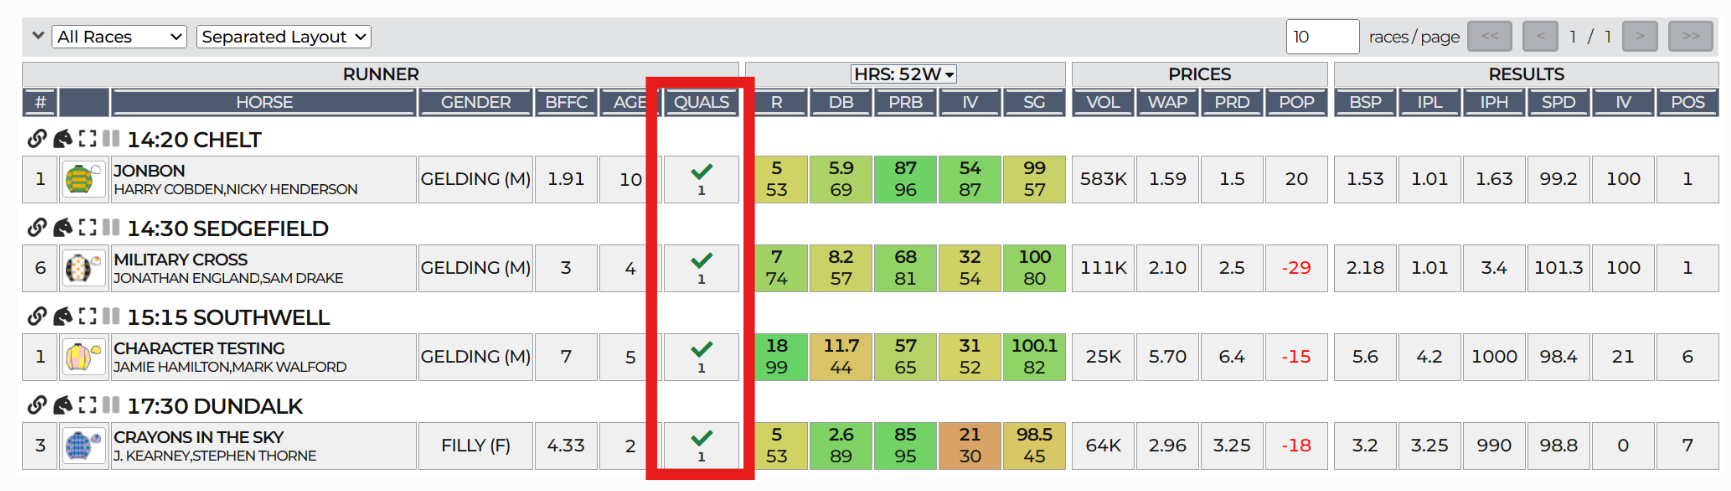
The runner table has a ‘quals’ column – this shows on single races and can have either a simple icon: (tick for qualifier, or hourglass or potential qualifier), or a list of named projects / systems.
Controls Layout
This simply refers to the settings icons themselves – you can show icons only, labels only or icons + labels.
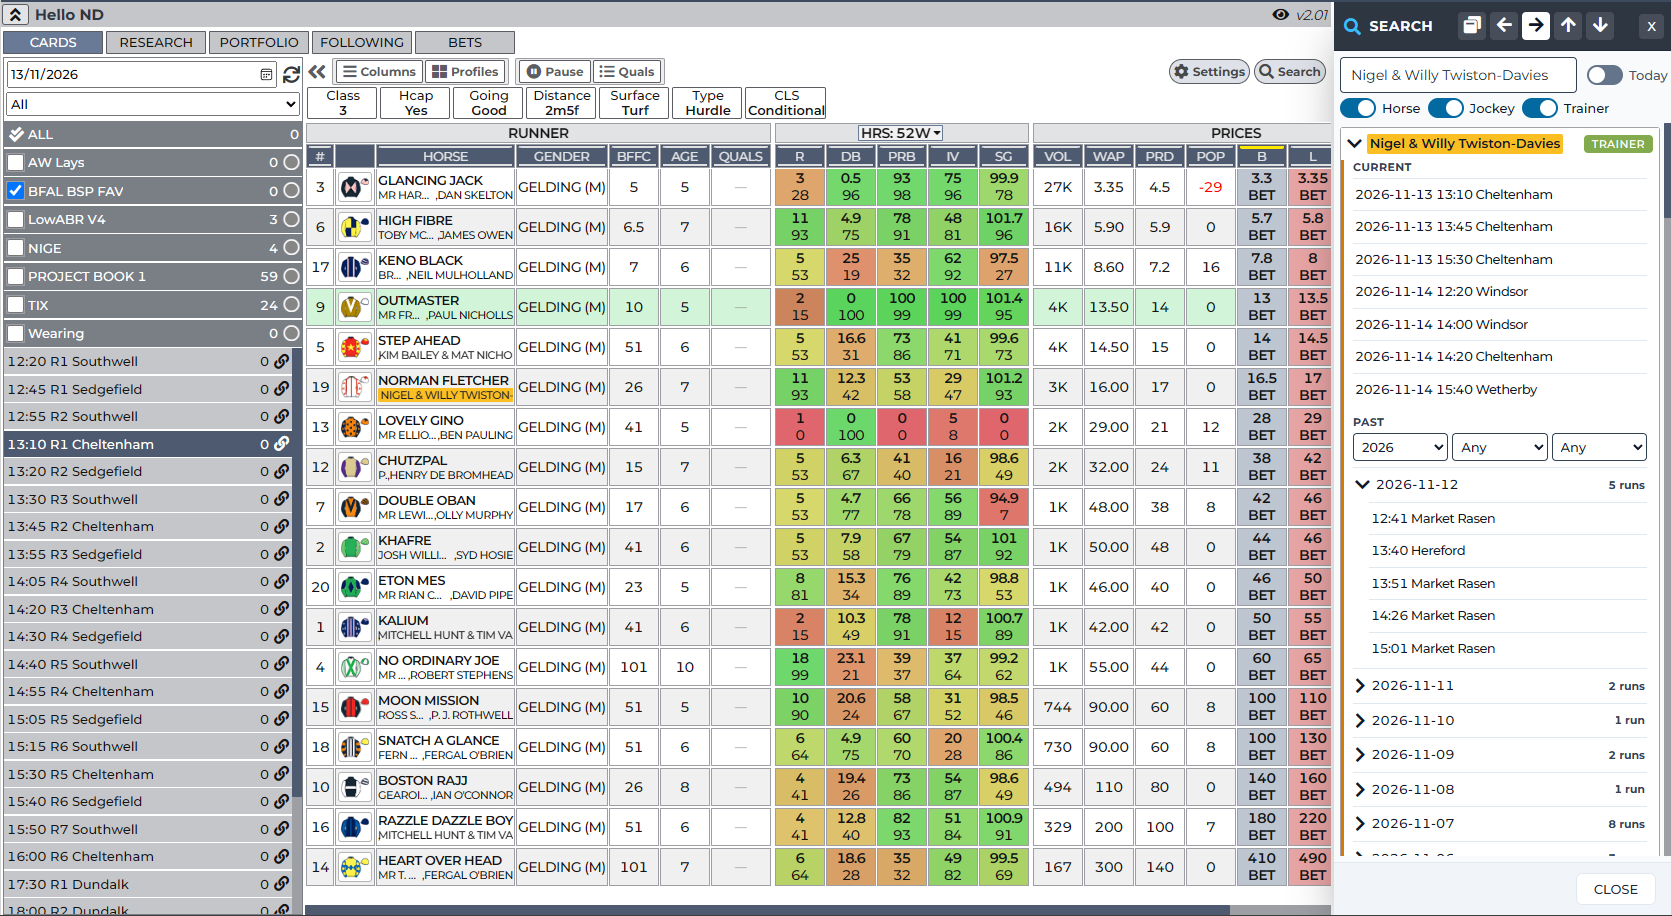
Search
The search dialogue is a powerful tool that allows you to find horses, jockeys and trainers.
You can restrict the search to todays races only to make filtering easier, also – you can choose the entity type you want.
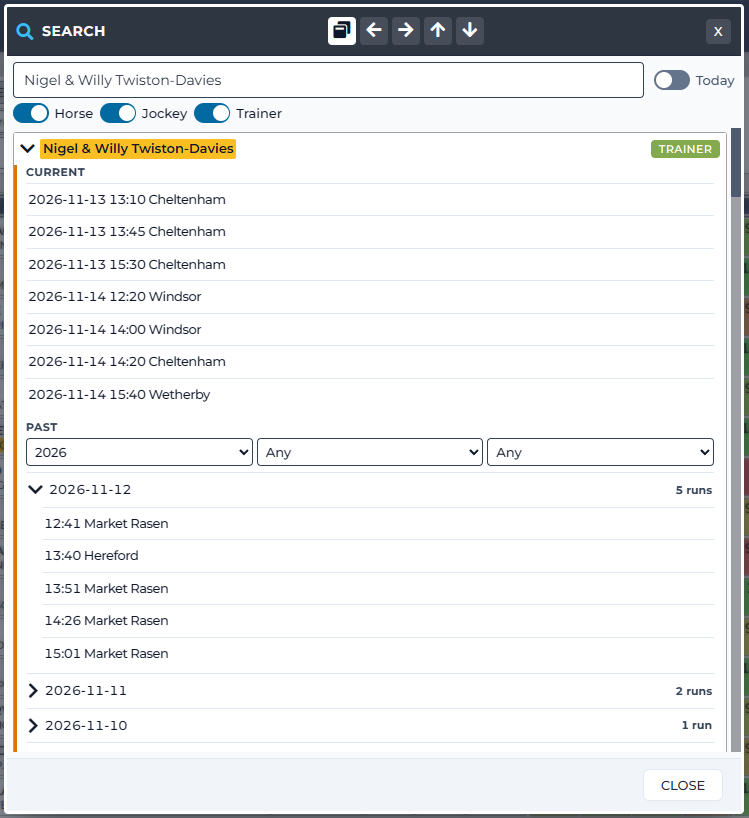
The top middle controls pin the search box to the right, left, top or bottom (or as a floating popup). Pinning it means you can carry on navigating the cards while the search window is still open. The search windows has current and past races that you can click to load into the main card – the search window will remain in place.
Search by name and all matches will be listed – with ones in the race you are currently loaded are highlighted.
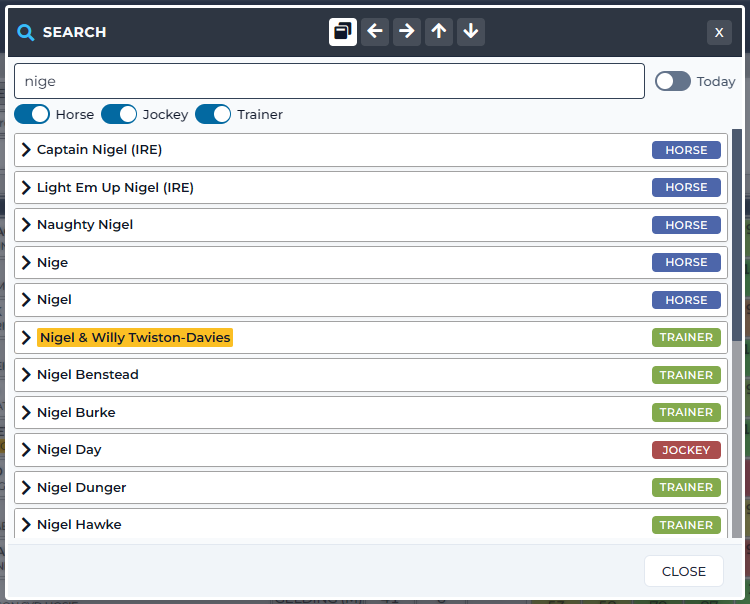
Click an entitles name – Trainer in this case, and you can see the current races they have a runner in. Also, past races organised by date – which can be filtered by year, month and day if required.
Pinning to the right (for example) allows you to maintain a view of the cards as well as use the search system.
Runners Card
This main table shows either a full race or a list of runners that match your project shortlist qualifiers, both show all the information that you might need for your analysis – or just to check your daily qualifiers.
As shown above, you can specify the data you want to see.
Races
Individual races show all the stats and information per runner in that race
Project Shortlists
Clicking on a shortlist loads the qualifying runners – both pre MTP potential and post MTP actual.
You can display them in a combined single list, or separated per race
Race Information
Race Information is shown above the cards. If you are viewing a shortlist these change as you roll over each runner.

Table Layout
| Group | Available Columns & Data |
|---|---|
| Market | Race Time, Venue Course *(essential for shortlist views)*. |
| Race | Number of runners, race class, handicap indicator, going, distance. |
| Runner | Draw stall, jockey silks, horse name, age, carried weight, official rating (OR), days since last run (DSLR). |
| Stats | Strike rates, runs, wins, and form over custom lookback periods for Horse, Jockey, Trainer, and Combo. |
| Prices | Live Betfair Back and Lay prices, volume traded, price sparklines, hedge potential (HP), weighted average price (WAP). |
| Results | Official BSP, finishing position, and in-play maximum/minimum prices *(appears automatically on closed/settled races)*. |
Market
- Time – Race Time
- Venue – The Course Name
Race
- RNRS – Number of Runners.
- BKM – Book Male – this is market share (combined chance of winning) from male horses.
- CLS – Race Class.
- HCAP – Handicap (Y or N).
- RCT – Race Classification – Maiden / NHF / Chase etc. (can be more than 1).
- GOING – The official race going.
- SFCE – The course surface type.
- TYPE – The race type or code (NHF, Chase, Hurdle, Flat).
- DIR – Track Direction (of this race) – Straight / Left / Right / Figure of 8
- PROFILE – Track Profile (Flat, Undulating etc).
- CONFIG – Track Configuration (of this race) – Sharp, Galloping etc.
Runner
- # – Saddle Cloth Number.
- DR – Stall Draw.
- COLOURS – Silks
- HORSE – Runners Name.
- WEARING – List of Equipment.
- C – Has the horse won on this course (Y / N).
- D – Has the horse won over this race race distance (Y / N).
- CD – Has the horse won on this course and distance (Y / N).
- BORN – The country the horse was born in.
- GENDER – Fill / Mare etc.
- BFFC – The Betfair Betting Forecast Price.
- WGT – Weight being carried.
- OR – Official Rating.
- DSLR – Number of days since the horse last ran a race.
- DT – The distance the horse has travelled from its yard
- TT – The Time it takes to get from the yard to the course.
- QUALS – Shows project qualifers.
Stats
Core Stats are metrics about the entities past performance. The y are an average of the period selected.
- R – Number or total runs in the period (on an average)
- W – Total wins (not an average)
- SR – Strike Rate
- DB – Distance Beaten – a win counts as negative its winning distance. but the rolling average is pinned to zero as lower bound anyway.
- PRB – Percentage number of rivals beaten.
- HP – Hedge Potential – The average of the max Hedge edge you could have gained from past runs – its a measure of odds performance.
- IV – Impact Value – Another in-play performance measure – how low the in-play odds get compared to what we expect from a runner with its starting odds (and some other factors) it gets a score.
- SG – Speed Grade – 100% is on par, over is better than.
- BR – Book Reduction. The average of the absolute chnage in book of the runner from BSP to in play low. Book being 100 / odds.
- PD – Price Drop – The average of the change in actual price, again BSP to in-play low.
Best / Worst and Trend.
The best and worst are the rolling average the entity has had in that period. Its not the best absolute value.
The trend is the way the current rolling averages are trading – are they going up or down!
These sets of columns have all the same as the stats barring R, W and SR.
Prices
Data related to the runners prices.
- PRICES – A chart of the days price history.
- VOL – The amount traded of the runner.
- WAP – The weighted average price.
- WPL – Lowest WAP seen.
- WPH – Highest WAP seen.
- PRD – Predicted Back Price – what we think the back price should be based on volumes traded and market trends.
- POP – Popularity – PRD compared to WAP.
- HP – hedge Potential – what we think the runners HP might be for B2L or L2B opportunites.
- B – The current BACK price.
- L – The current LAY price.
- RB – The rank of the back price (1 = fav).
- RL – The rank of the lay price – useful for matching to you systems criteria.
Results
Set of metrics pertaining to the result of the race / runner.
- BSP – The final BSP of the runner at the off.
- IPL – The lowest price traded in-play.
- IPH – The highest price traded in-play.
- HP – The actual Hedge Potential – BSP / in-play low as a percentage.
- SPD – The Speed Percentage Grade.
- IV – Impact Value achieved.
- POS – Actual finishing position.
VIEW
Just one column option here (VIEW) – adds a search icon to the right of the cards that opens the runner details – which can be opened by clicking on the runner name as well.
Runner Information
Open up detailed runner information by clicking on the runner name
Previous
The horses previous runs are shown with information about each race, these include:
Date, Venue, Runners, Class, Race Classification, Distance (in Yards), Going, Surface, Race Type, Jockey, Trainer, Official Rating, BSP, Low In-Play Price, High In-Play Price, Total Distance Beaten and Position.
MTP Odds
The odds at set minutes to post intervals – that match the research options (240, 120, 60 ,30, 15, 10, 5, 4, 3, 2, 1)
The cols shown are:
- MTP – The minutes to post the data was taken
- AFW – After the Reduction Factor has been accounted for (the odds you would be settled at if you took that at the time)
- RANK – Back odds rank
- WAP – Weighted Average Price
- FAV – The back odds of the race favourite.
- Book – The market book.
- VOL – Runner traded volume
- MK VOL – Race raced volume.
- VOL% – The percentage of runner volume against race volume.
- PRD – Our predicted odds at the time.
- POP – Our popularity metric at the time.
- HP – Our Hedge Potential at the time.
- RNRS – The number of the runners – this can reduce closer to the race with withdrawals.
Details
More entry information and full details off stats that drive the research engine – in tabular or graphical form.
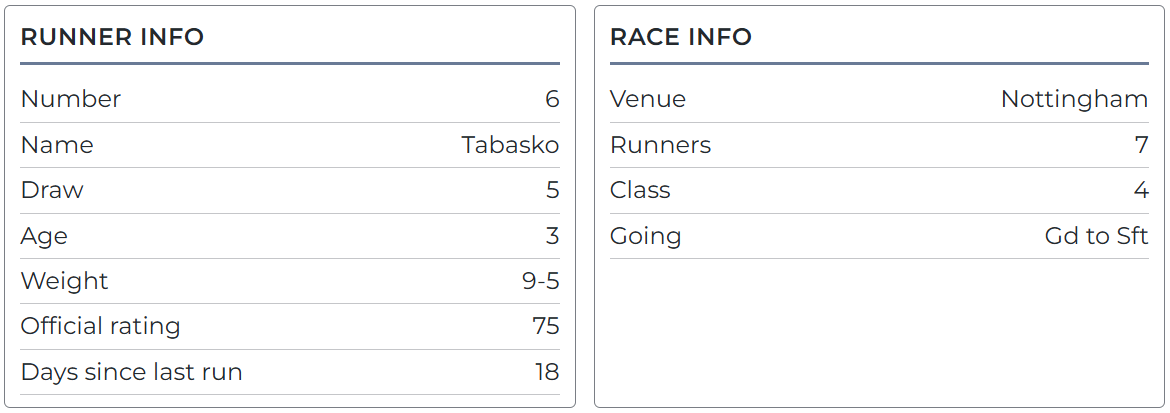
Entry
Runner and Race information:
Stats
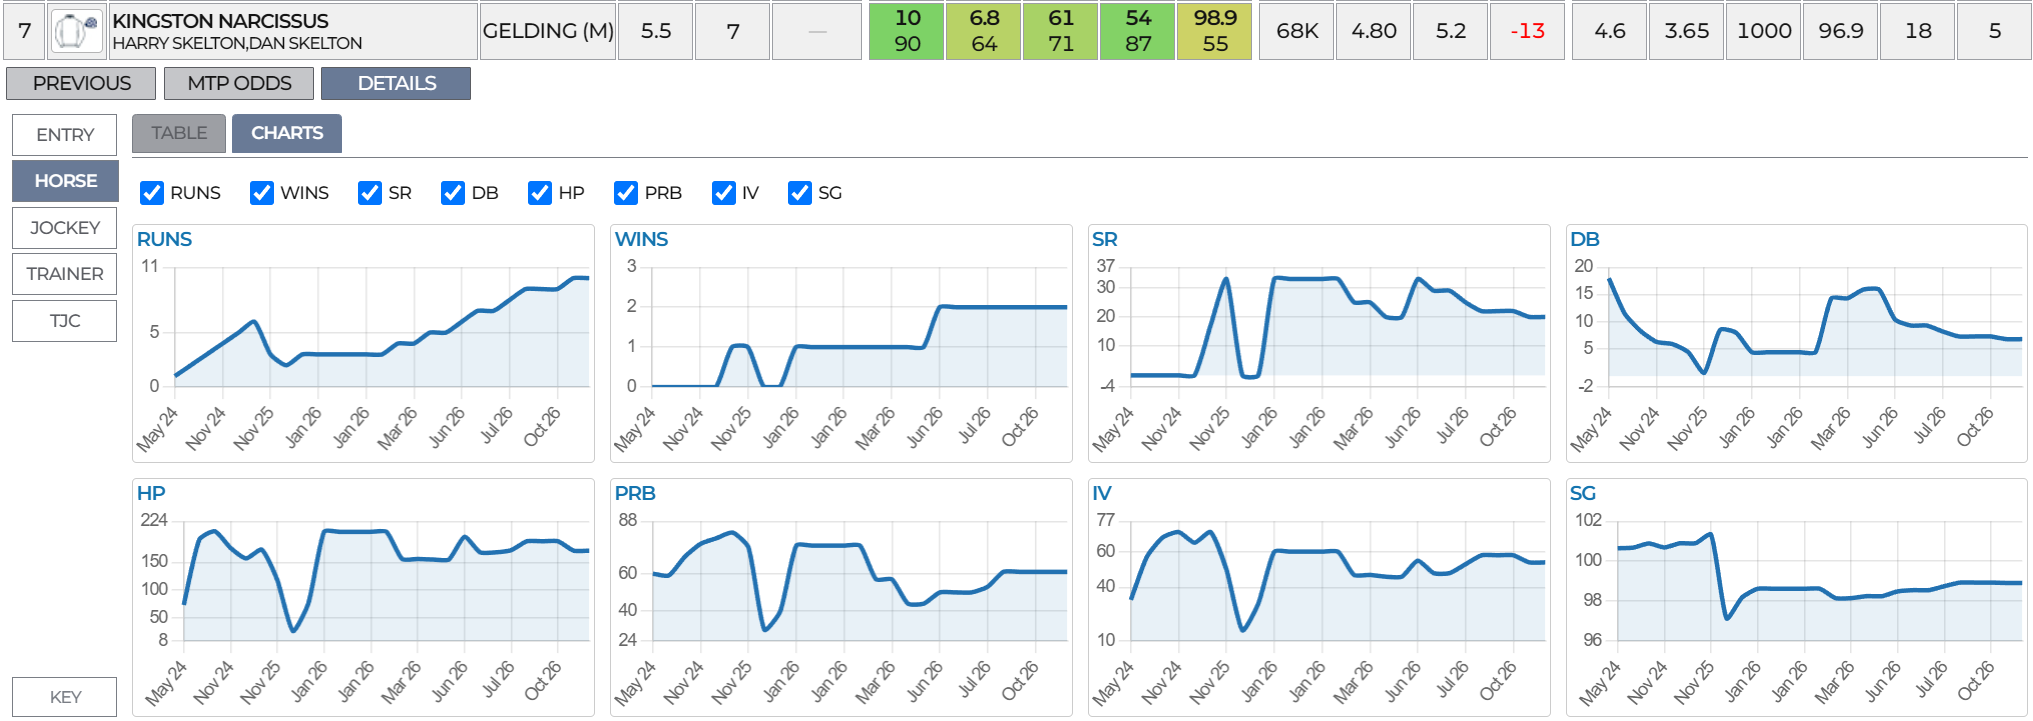
Horse / Jockey / Trainer and TJC (Trainer Jockey Combo) full stats all in one view.
TABLE shows metrics row by row and the CHARTS show a rolling average of the stats. Here we have HORSE 12 month stats, the chart values are 12 month rolling average over time (not actual race result values that make up those averages).
Betting Slip
You place or schedule a bet via the race cards – open it by clicking the BACK or LAY odds in the PRICES block.
The Betting Slip
Choose the bet side – BACK or LAY.
Choose the bet type – HEDGE or SINGLE. A single bet just orders one bet, a hedge orders another of the opposite side with an in-play persistence. The Hedge Target is used to adjust the percentage you want to try and make. 100% is a DOB (Double or Bust with Double meaning the return), the percentage here is the profit.
You can place the bet straight away or schedule it – our system will handle this for you and you do not need to web app open or running for it to be ordered.
Scheduling requires a MTP (minutes to post) want it to be ordered. A min and max odds are available as well as a option that required the selection to be a qualifier for one of your projects.
Cards Indicators
Badges are shown in the runner column if you have bets ordered (from the bet slip or full project automation), or scheduled bets.
| Badge | Meaning |
|---|---|
| SB | Scheduled Back – order waiting to fire at MTP. |
| SL | Scheduled Lay – lay order waiting to fire at MTP. |
| B | Back order submitted or matched on the exchange. |
| L | Lay order submitted or matched on the exchange. |
| B2L / L2B | Hedge order in progress – opening bet placed, closing bet queued. |
As the race approaches and your bets match or settle, these badges update automatically
Qualifiers
What are Qualfiers?
When a runner matches the rules of your saved project systems then it becomes a QUALIFIER.
Runners that match static rules then it is flagged as a possible qualifier, static metrics are ones that do not change like course, last time out and stats. You can see this list with the QUALS dialogue – as described above.
⏳ Possible Qualifiers that match dynamic criteria, but the race has not yet reached the MTP cutoff of your project, are assigned as potential quillers. Static metrics are things that do not chnage like course and stats.
✓ Possible Qualifiers that match dynamic criteria and dynamic criteria at your projects MTP are assigned as quillers. Dynamic metrics are odds (and anything in the prices section) and race field size. The filter values are fixed at the chosen MTP and do not change after that.
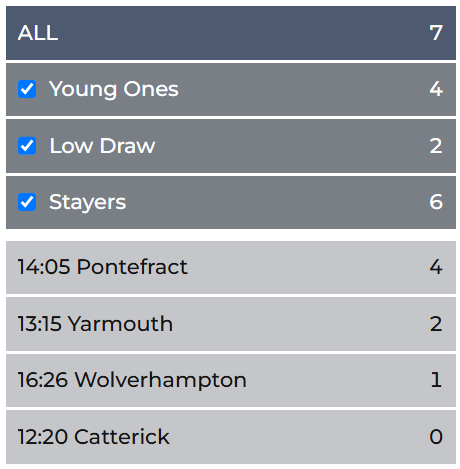
In the Race List
The race list shows a number of actual + potential qualifiers for each project and race. The ALL number is a sum of checked projects. Race qualifiers numbers are also only from checked projects.
In the Race Card
The PROJECTS column lists which project(s) the runner qualifies for.
In the Breakdown Dialog
The PROJECTS column lists which project(s) the runner qualifies for.
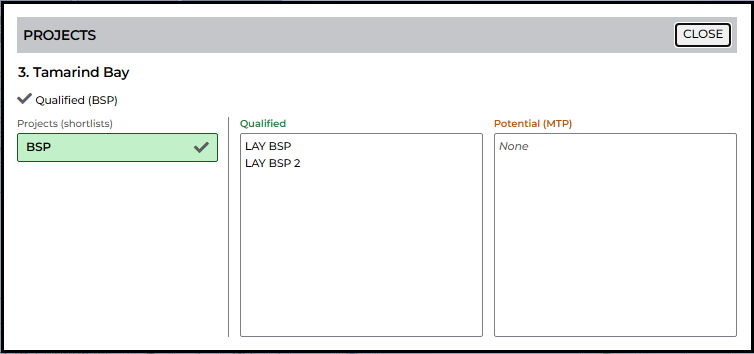
If a horse qualifies for multiple projects or a project containing several child systems, simply click on the PROJECTS cell. This opens the Projects Breakdown Dialog:
- Qualified Tab: Shows every specific child system the runner currently matches.
- Potential (MTP) Tab: Shows child systems the runner could qualify for once MTP odds are snapshotted.
Historical Qualifers
- Choose a past date in the cards to see past qualifiers day by day, race by race.
- Use the (binoculars icon) on the Portfolio Tab to see all past qualifiers.
- Export a full list via the Project Management / Export popup (from the Research Tab)